
In this article, inspired by Andrea Allievi’s Debugging the undebuggable – Part 1 blog, I explored the very earliest part of the Windows boot flow, and made some discoveries about what precedes the launch of Hyper-V.
In Andrea’s article, which dealt with the use of QEMU, WinDbgEXDI and GDB to debug early boot code and boot transitions, he made the following comment:
“There is a problem that we need to face before starting. How do you know when you can intercept the code execution? The answer is … you DO NOT! This is why my colleague and friend Alexis from the debugger team had the idea of the “enablejtagbreak” BCD element, which allows you to break before the Windows loader starts.”
What he is referring to here is essentially where do you break into the code (with, for example, a JTAG debugger), so that you can begin to debug Windows from very early on? If you’ve read some of my earlier blogs on Hyper-V debug, you know that one technique I’ve used is to halt at the UEFI shell, set a VM Launch breakpoint, and then hit Go; in which case you land in hvix64, the Windows hypervisor (which interestingly always shows up initially in Guest mode, or at least that is what JTAG probe mode says). A second Go stops in hvloader. A third Go hits the third VM Launch break, this time in securekernel. Of course, at this point we are in VTL 1.
The downside of this approach is, how do you debug prior to entering the hypervisor? You do this with the “enablejtagbreak” BCD element as described above.
This will all make more sense if you have a copy of SourcePoint, and a DCI/JTAG-enabled target like the AAEON UP Xtreme i11, i12, or (soon to be released) i14. I’ll take a cookbook-style approach on how to set up the debugger host PC and physical target so you can watch the early boot process in action.
First things first, for those following in these footsteps: “enablejtagbreak” is only available in Windows 11. I’m not sure which build it initially showed up in, but if you are on the latest and greatest, it is supported. It is not supported on Windows 10. I initially tried to get it working there, and when you do the needed bcdedit, you get an error message (sorry, I didn’t preserve the error text; but you’ll know it if you see it).
Another thing to keep in mind is that in order to upgrade your AAEON board target to Windows 11, you need at least two cores available. In my prior blogs in this series, I downsized the number of active processors to 1 using the “CRB Advanced” BIOS menu, so we could more easily see VMM transitions. You’ll have to bump these up, otherwise Windows won’t let you upgrade, but doesn’t really give you a reason unless you dig. I admit this stumped me for a while. Once you’ve finished the upgrade to Windows 11, you can bump the number of active processors back down to 1.
Another thing you’re going to want to do is to set up a Windows boot menu, so you have the choice of booting into your regular Windows 11, or your “special” boot that invokes the enablejtagbreak. This is because the enablejtagbreak BCD puts a “deadloop” into a couple of areas of early code, that you can only easily break out of with a JTAG debugger. Otherwise, when the code gets to the deadloop, it just spins and spins and all you see is a black screen. Do this with the following commands on the target:
bcdedit /set {bootmgr} displaybootmenu true

bcdedit /set bootmenupolicy Legacy
Set these before copying the {current}, so each entry gets the same settings:
bcdedit /set recoveryenabled no

bcdedit /set bootstatuspolicy ignoreallfailures

bcdedit /set loadoptions "systemwatchdogpolicy=disabled"
Now copy {current} to the JTAG BCD. Make a note of the GUID (you’ll need it):
bcdedit /copy {current} /d “JTAG”
Now set the jtagbreak for this entry:
bcdedit /set {GUID from last command} enablejtagbreak on
Then reboot and you’ll have the selection menu, like the one below. Note that I’ve got a couple of “JTAG” boot configurations for different experiments I’m working on; you only need the one:
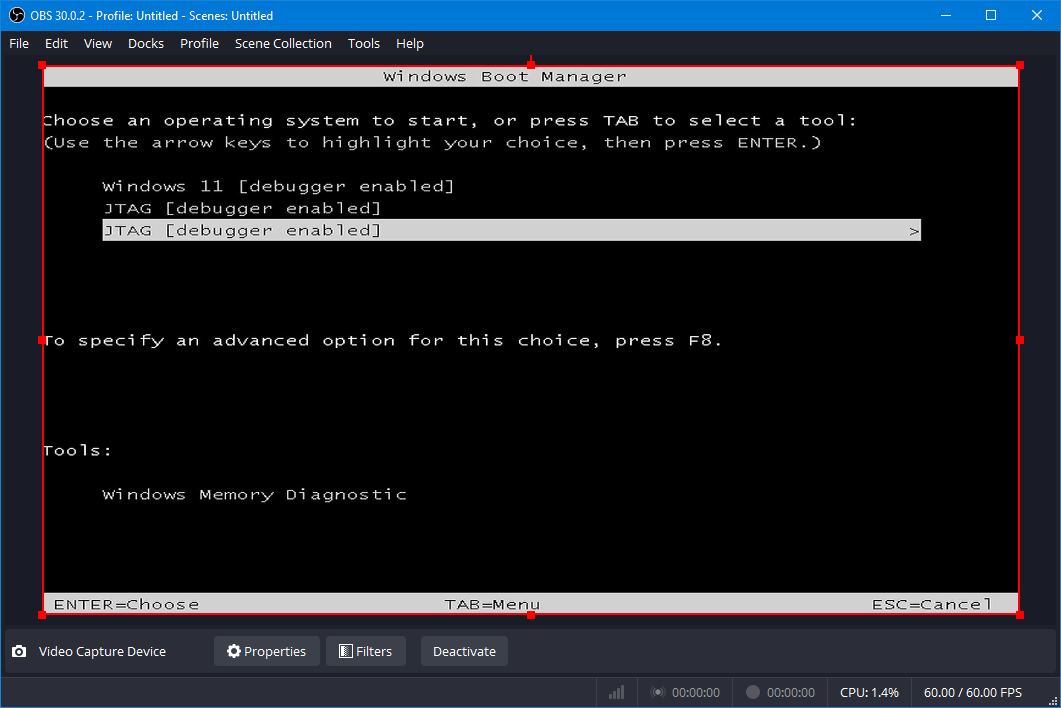
Once you select the JTAG boot option, you’ll exit the above screen, and just see a black screen. That’s because we’re in the deadloop. Halt the target with SourcePoint, and you’ll see in the Code window:
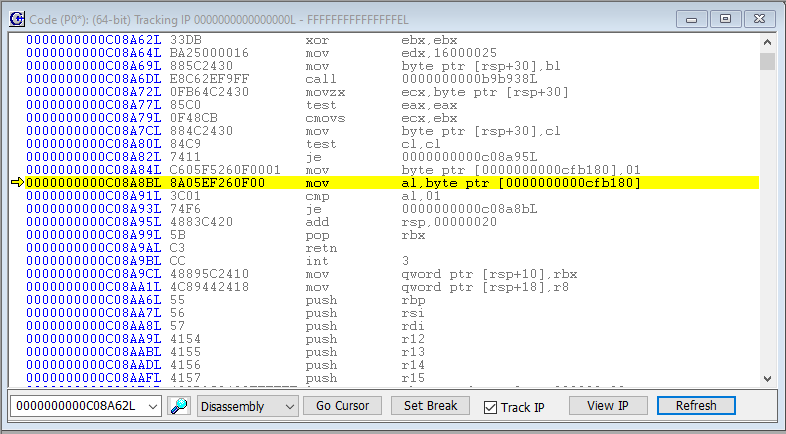
Note that we’re in a very tight loop between addresses C08A8B – C08A93, bracketed by the MOV, CMP and JE instructions. Under normal circumstances, you’ll never exit from this loop. You can hit Go and set the target to Running, and it’ll run forever. Or you can use SourcePoint to single step, and eventually you’ll get tired. The code is in a deadloop. This was put here as part of the JTAG boot configuration, as we are in the very earliest stages of Windows.
It’s also worthwhile noting that we are in 64-bit mode. This target is Hyper-V enabled, but we haven’t gotten to the hypervisor yet:
![]()
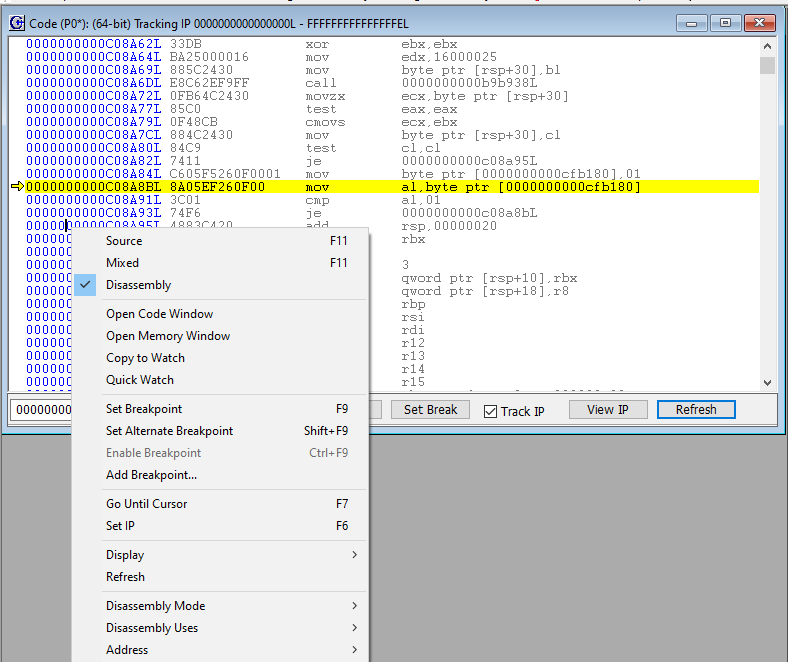
Breaking out of the deadloop is very easy with a JTAG debugger. Simply right click and place the cursor outside of the deadloop, like at address C08A95, and click on “Set IP” or press F6:
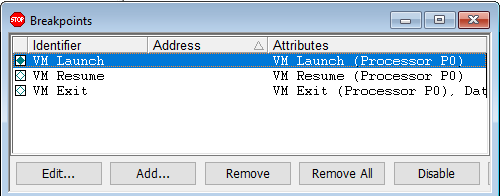
As a next step, enable a VM Launch breakpoint; we won’t hit it yet, but its use will become apparent later.
Once last thing before we start the rest of the boot process; let’s do a LoadCurrent so we can see the symbols associated with where we are in the code:
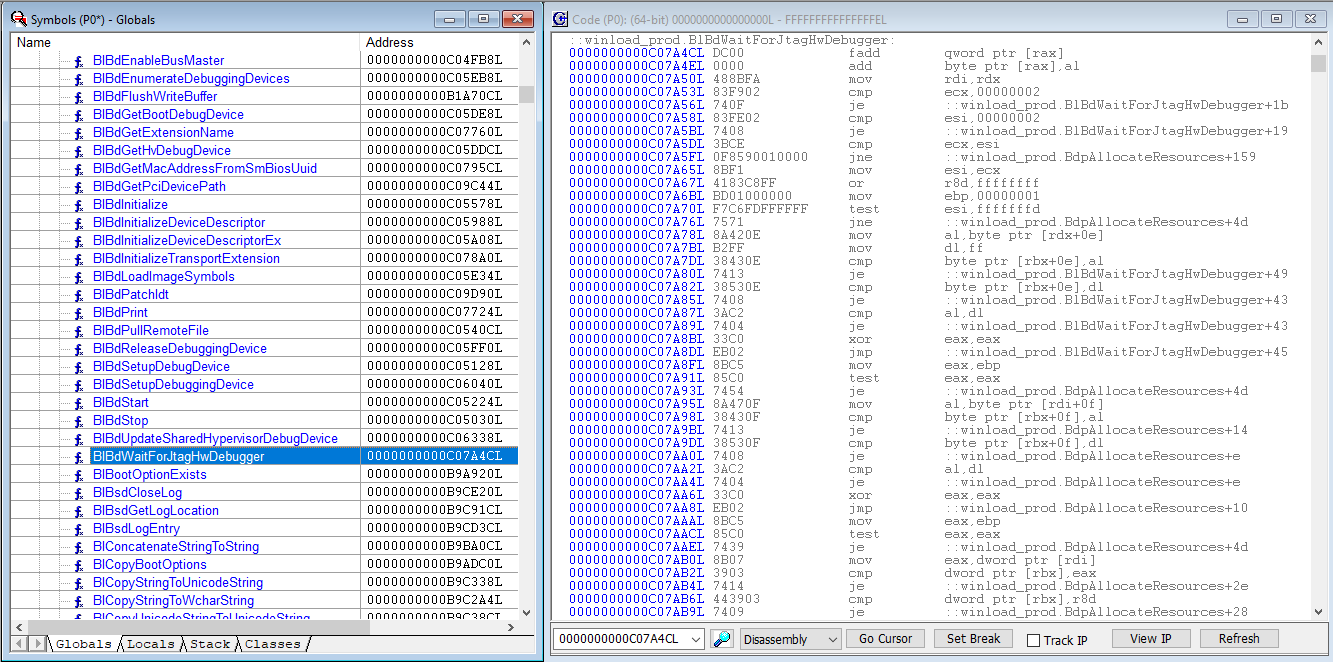
We’ve stopped in winload_prod.BlBdWaitForJtagHwDebugger. Very nice.
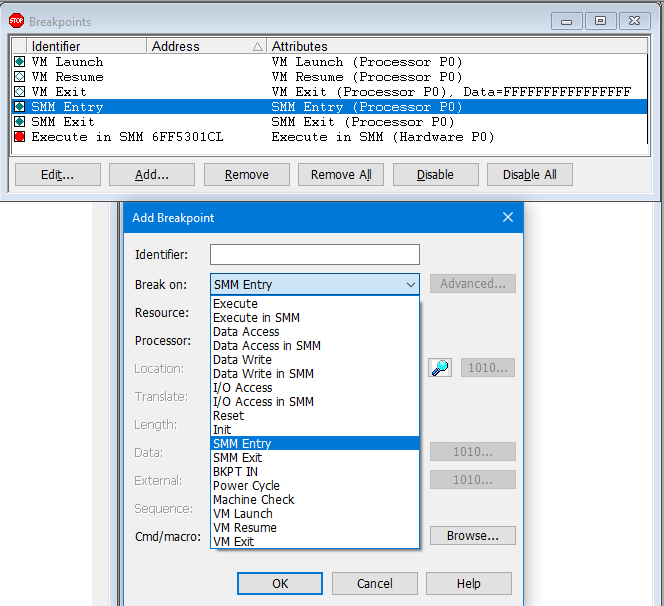
Now, there are a number of different things to explore at this point. Technically, we’re in Windows, so we could just single-step around and see what happens. We can use Intel Processor Trace to see the code flow to the next breakpoint, wherever we define it. We could use AET to see what low-level architectural events are happening on the Intel CPU in this area of code. We could set breakpoints down in UEFI runtime services code to see their execution. Did you know that you can watch UEFI code being invoked from Windows? Here are some thoughts: set some SMM-related breakpoints like SMM Entry, SMM Exit, or Data Access/Data Write/I/O Access/Execute and observe the results (note that Intel PT is disabled on SMM entry and enabled on SMM exit):
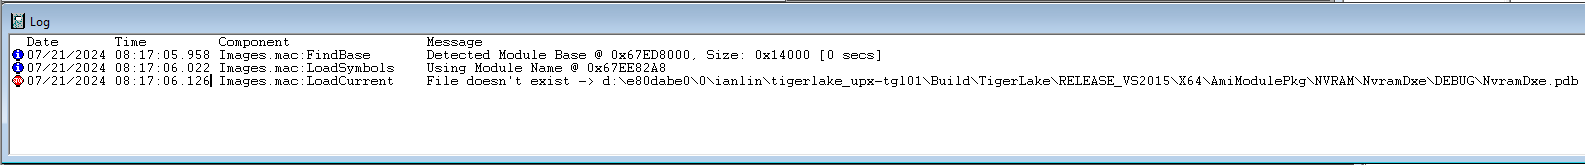
Hit Go and see what happens. That’s fun; and then single step a number of times, and use the LoadCurrent button to see at least the name of the module that’s being invoked at each branch. Here are a few examples in SmmControl, PiSmmIpl, and NvramDxe:


A short sidebar: on the UP Xtreme i11 Tiger Lake board, there are no source and symbols available. You can see module names as above, but that’s about it. If you want to work with UEFI source and symbols in addition to Windows symbols, your best choice is the UP Xtreme Whiskey Lake board. I’ve written a couple of articles on how to do a complete Tianocore UEFI debug build with source and symbols, and then debug with SourcePoint, that you can read here:
JTAG Debug using DCI on the AAEON UP Xtreme Whiskey Lake board
Hypervisor and OS Kernel Debug with DCI on the AAEON Whiskey Lake board
It’s a lot of work; I spent a few weeks going through the steps and documenting the procedures. But if you have an interest and follow the instructions, it’ll be much quicker, and you’ll have a very powerful debug environment, unmatched for debugging UEFI in conjunction with Windows.
For now, I thought that an interesting area of investigation was to watch the boot progression using my typical approach of using VM Launch breakpoints. The results were interesting.
The first VM Launch break takes you into hvix64, just as before. There are of course no symbols. As with before, probe mode tells us that we are in VM Guest mode.
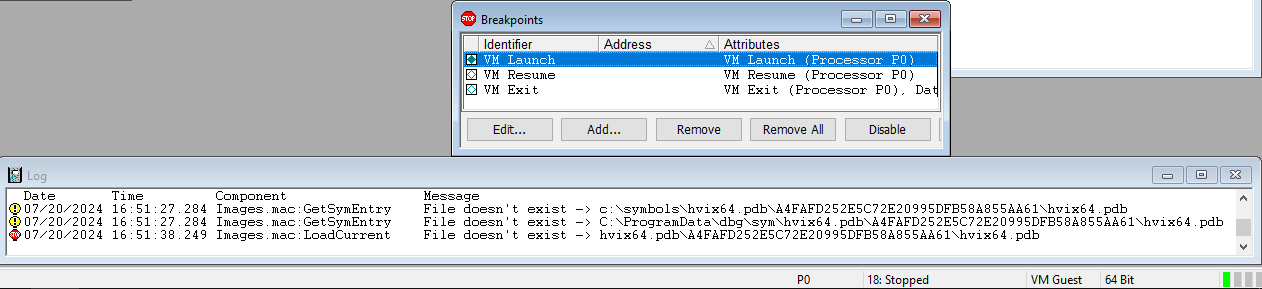
Hit Go again. The second VM Launch breakpoint puts us in hvloader, in User land, in Guest mode:
Hit Go again. This time, unexpectedly, the third VM Launch breakpoint is not hit. The target remains in a Running state, but the screen just shows the UP Xtreme i11 splash screen; it does not boot to Windows:
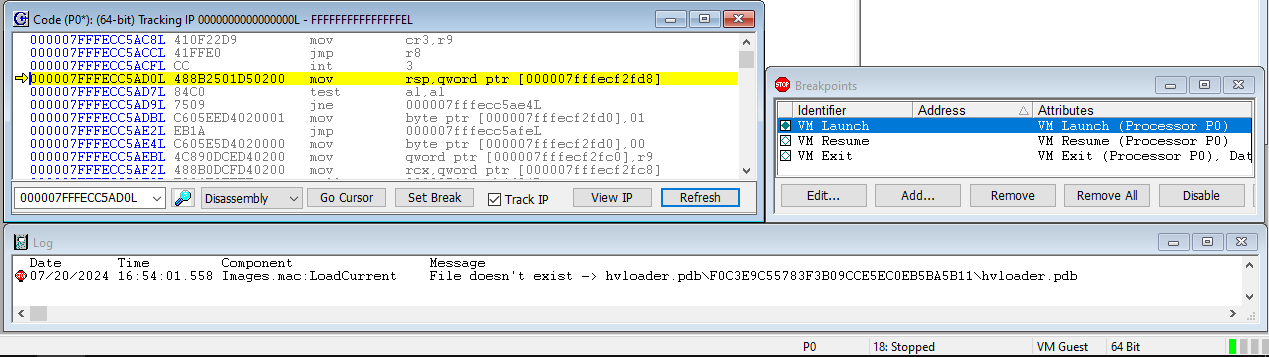
I guessed that we’re in another deadloop. Just halting the target using SourcePoint bears that out. Doing a LoadCurrent makes it very clear:
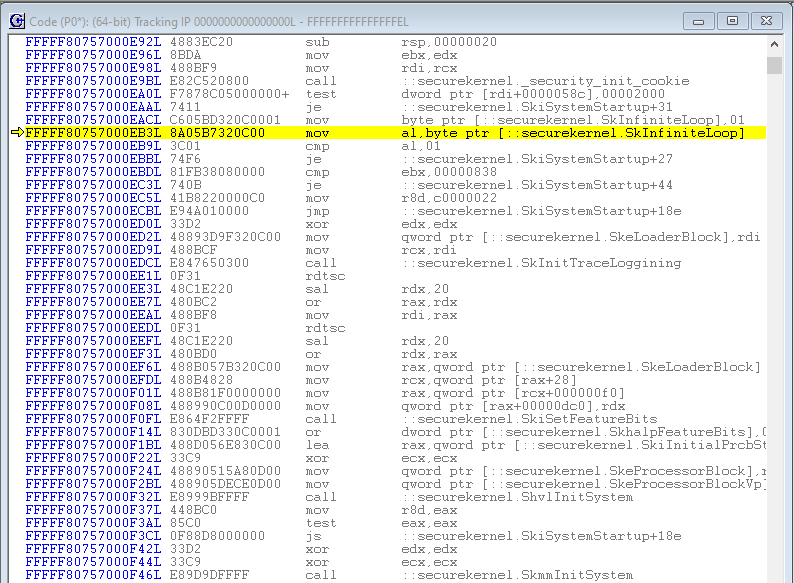
It’s important to note that this deadloop is before securekernel.ShvlpVtl1Entry, the function that we entered into in my earlier blogs with previous VM Launch breakpoints. ShvlpVtl1Entry seems intuitively to indicate the Secure Kernel entry into VTL 1. I conclude that the code that we’re in, sitting in the SkInfiniteLoop, is in VTL 0. Which makes sense, as expressed in Windows Internals Part 2, Chapter 9 Virtualization Technologies, under the VSM startup section:
“The Secure Kernel is dependent on the hypervisor, the Windows Loader, and the NT kernel to properly start up. We discuss the Windows Loader, the hypervisor loader, and the preliminary phases by which the Secure Kernel is initialized in VTL 0 by these two modules in Chapter 12.”
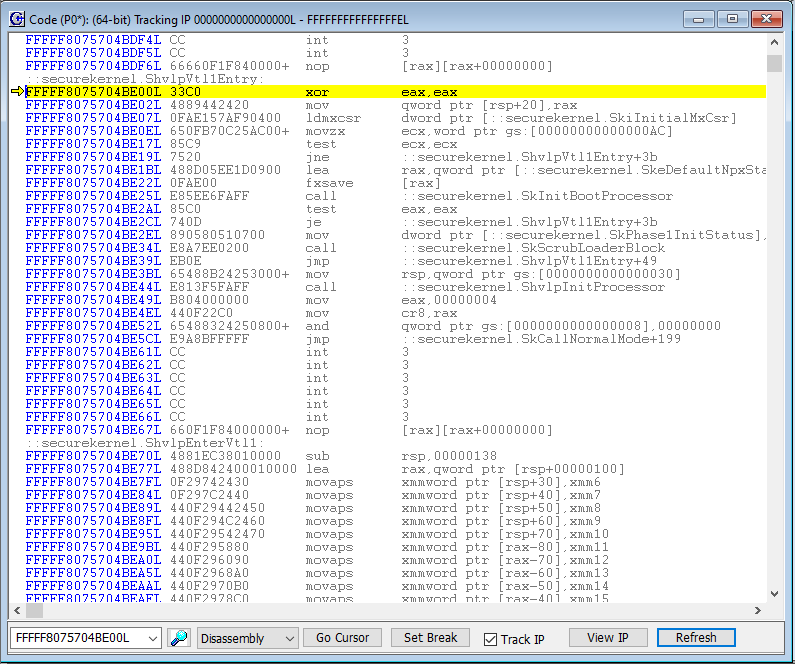
To proceed, as before, we can put the cursor below the JE instruction, and right-click on Set IP, thereby exiting the deadloop.
If we hit Go again, we hit the VM Launch breakpoint again, and do in fact enter VTL 1, with securekernel.ShvlpVtl1Entry:
Very interesting. Let’s recap a few of the highlights:
- We can use the enablejtagbreak BCD element to halt the target very early in the Windows boot, in winload_prod.
- We’re able to break into the Secure Kernel while in initial startup in VTL 0.
- SMM breakpoints supported by the SourcePoint JTAG debugger gives insight into how Windows interacts with SMM.
There’s so much more to explore. As mentioned above, much more insight into the Windows internals is made possible with SourcePoint’s additional features, such as the VMM breakpoints, VMCS Viewer/Editor, Intel PT, AET, etc. There’s a lot more to write about.