
Andrea Allievi of Microsoft published an excellent blog recently on the “rollback” attack and work that went into mitigating it in his blog Downgrade attack: a story as old as Windows… It was such an great article, and it gave a nod towards SourcePoint, our x86/Windows JTAG debugger, for which I’m quite grateful. Based on this, I decided to write this article on my initial explorations into the mitigations provided by Windows Defender Application Control (WDAC) and other Windows technologies.
To get started, it’s worth going over Andrea’s article with a fine-toothed comb, and look at the origins of the rollback attack’s discovery and resolution in the article Windows Downdate: Downgrade Attacks Using Windows Updates by Alon Leviev of Safebreach. Rollback (or downgrade or downdate, whatever you prefer) is a class of vulnerability that allows a system to revert from fully up-to-date and secure software back to an older version. This then exposes it to previously fixed/patched vulnerabilities.
This class of vulnerability initially got a huge amount of focus in 2023 with the BlackLotus UEFI Bootkit, which employed a downgrade attack. This malware downgraded the Windows boot manager to a version vulnerable to CVE-2022-21894 to bypass Secure Boot. Subsequently, Alon Leviev’s research discovered other vulnerabilities to the rollback methodology in other areas within Windows.
Andrea Allievi, one of our SourcePoint WinDbg beta testers, was deeply involved in driving the Microsoft team to resolve these other Windows vulnerabilities. His article Downgrade attack: a story as old as Windows… describes some of the technical challenges associated with these fixes, guaranteeing code integrity through application control. The essence of application control on Windows involves shifting from a model where all applications are assumed trustworthy, to one where applications must earn trust before they can run. This is done through WDAC policy.
My focus in the rest of this blog will be on debugging this code. As Andrea says in his article:
First, useless to say again that initial legacy WDAC policy are processed very early in the boot process, before every kind of debugger connect. So how to debug that? Easy, using JTAG (Exdi) or QEMU. Speaking of them, SourcePoint does a good job in stepping through the initial BootMgr code.
and…
Note that a lot of Code integrity code works only when Secure Boot is on. I have been able to install customized Secure boot keys in my QEMU virtual machine, and realized that in the AAEON board keys are already loaded by default, which mean that you can debug it (using the JTAG EXDI interface connected to SourcePoint) with Secure boot ON and witness also other WDAC policies being applied (like Secure Boot policies, which prevents the enablements of classical kernel debuggers).
So, let’s get started…
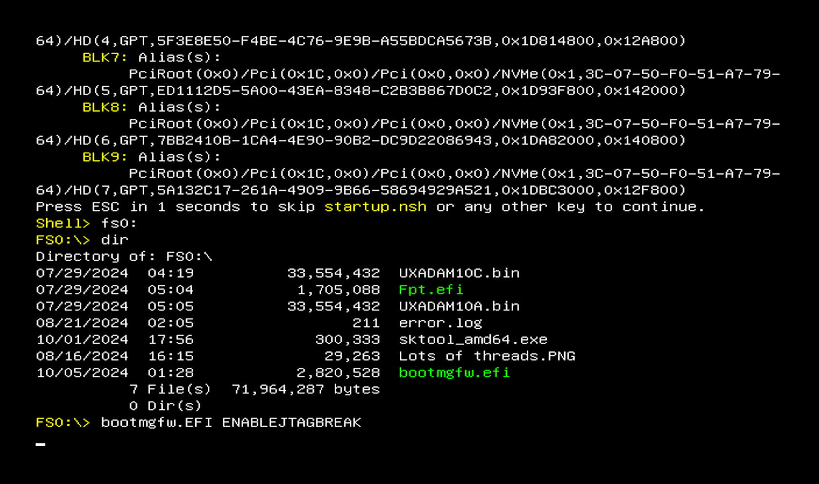
I installed the very latest Insider Preview build that’s available currently – 27718 – that has support for the ENABLEJTAGBREAK feature that I initially wrote about in my JTAG debug of Windows Hyper-V / Secure Kernel with WinDbg and EXDI: Part 9 article. I used that ENABLEJTAGBREAK to explore the VTL 0 Secure Kernel (sic). This ENABLEJTAGBREAK is new-and-improved, in that instead of using a bcdedit element, you just run bootmgfw.efi from the target’s UEFI shell. This of course is easy to do with the AAEON UP Xtreme i11 Tiger Lake board that also supports JTAG through its USB/DCI interface (for those who may not be familiar with this board and the public availability of JTAG in the wild on Intel/Windows off-the-shelf boards, I recommend glancing at the SourcePoint WinDbg page, or reading any of my recent blogs).
Once you install the latest Preview build, simply pull out bootmgfw.efi from C:\Windows\Boot\EFI, pop it on a USB stick, and connect that to the Tiger Lake board.
Pressing F7 while powering on the UP Xtreme i11 board takes you to the UEFI Enter Password screen. Enter “upassw0rd” (yes, that is a zero, not a letter “Oh”) gives you access to the Advanced BIOS menu, that has a wealth of interesting things.
For now, we’ll just click on the UEFI: Built-In EFI Shell and enter the UEFI shell. Look for the USB stick – it’s probably fs0:. Then type in:
bootmgfw.efi ENABLEJTAGBREAK
and then you see the screen and target freeze as it enters the ENABLEJTAGBREAK deadloop:
Now the serious debugging starts. Launch SourcePoint, halt the target, and load symbols to see code execution at a very initial stage of the EfiMain entry point of the Boot manager:
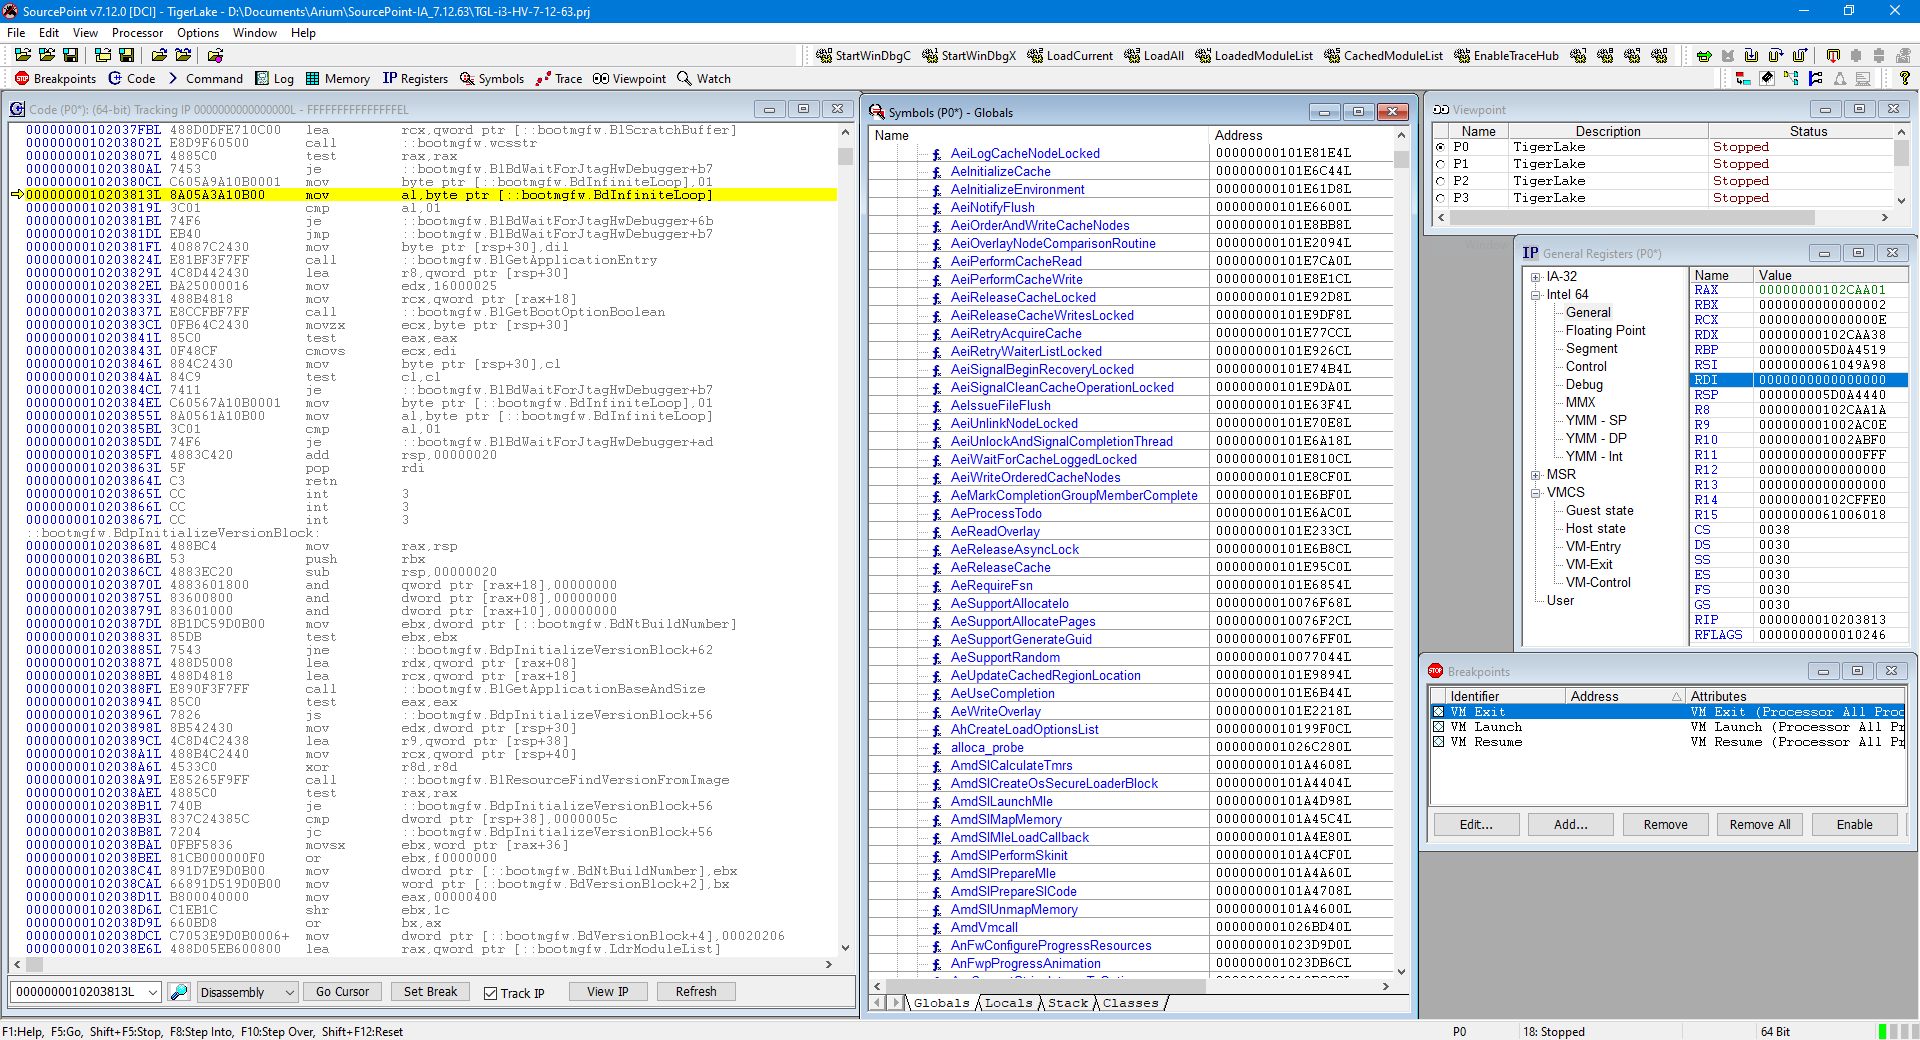
If you look closely, you can see that the instruction pointer is at the same place as shown in Andrea’s blog.
There are a few ways to get out of the MOV/CMP/JE deadloop. My favorite approach is to put the cursor a few instructions down, outside of the loop, right-click and do a “Set IP”:
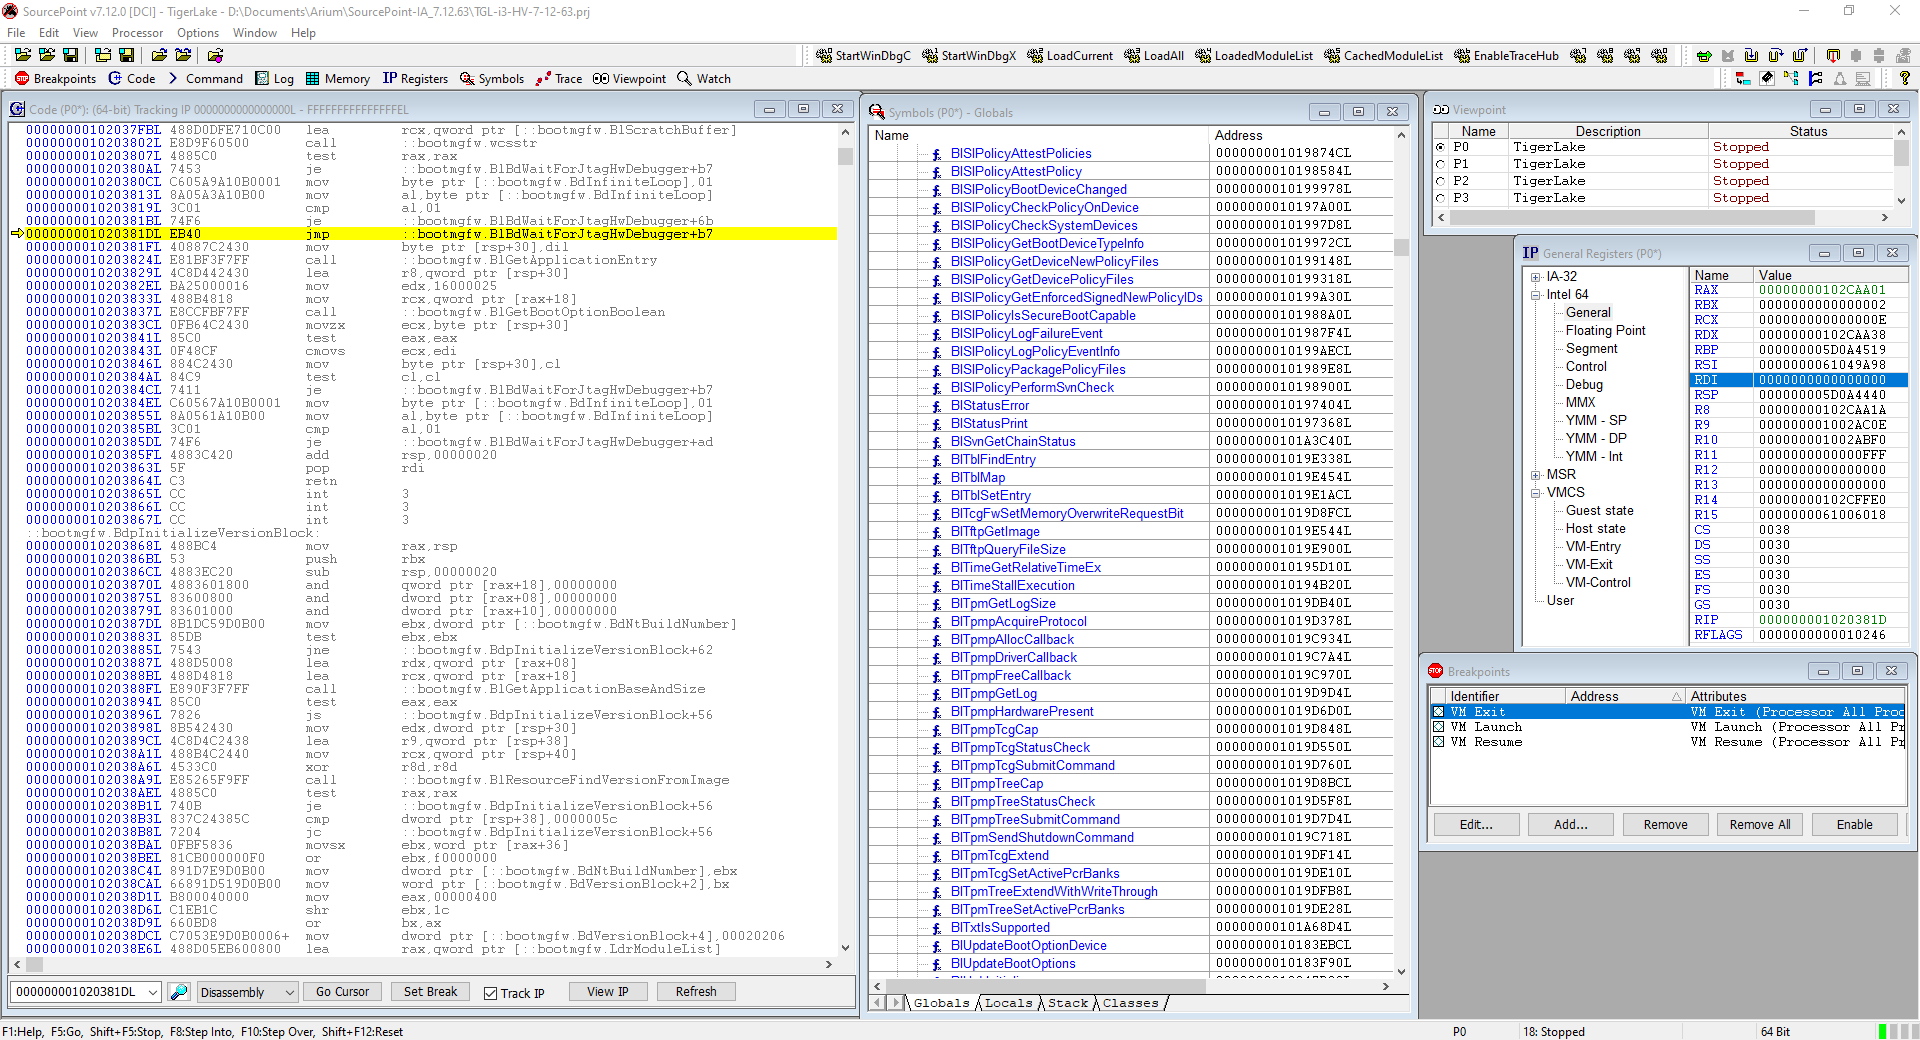
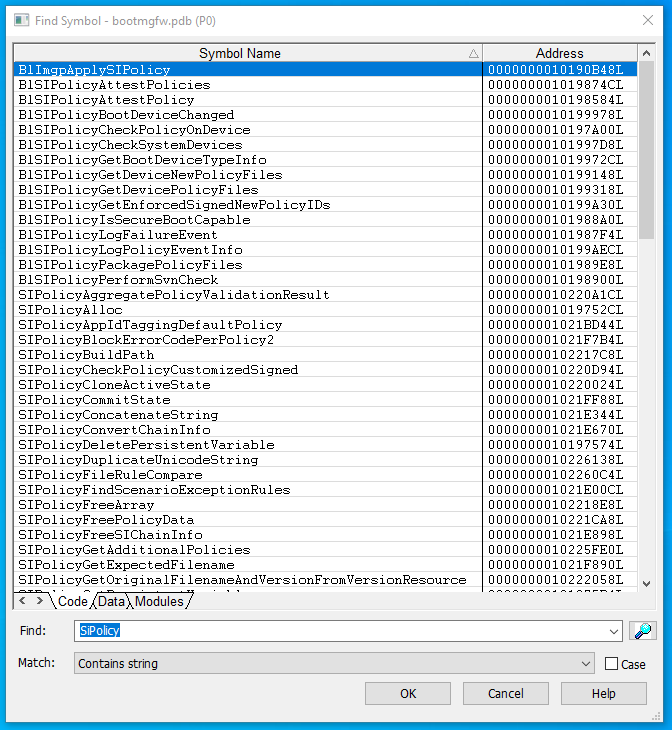
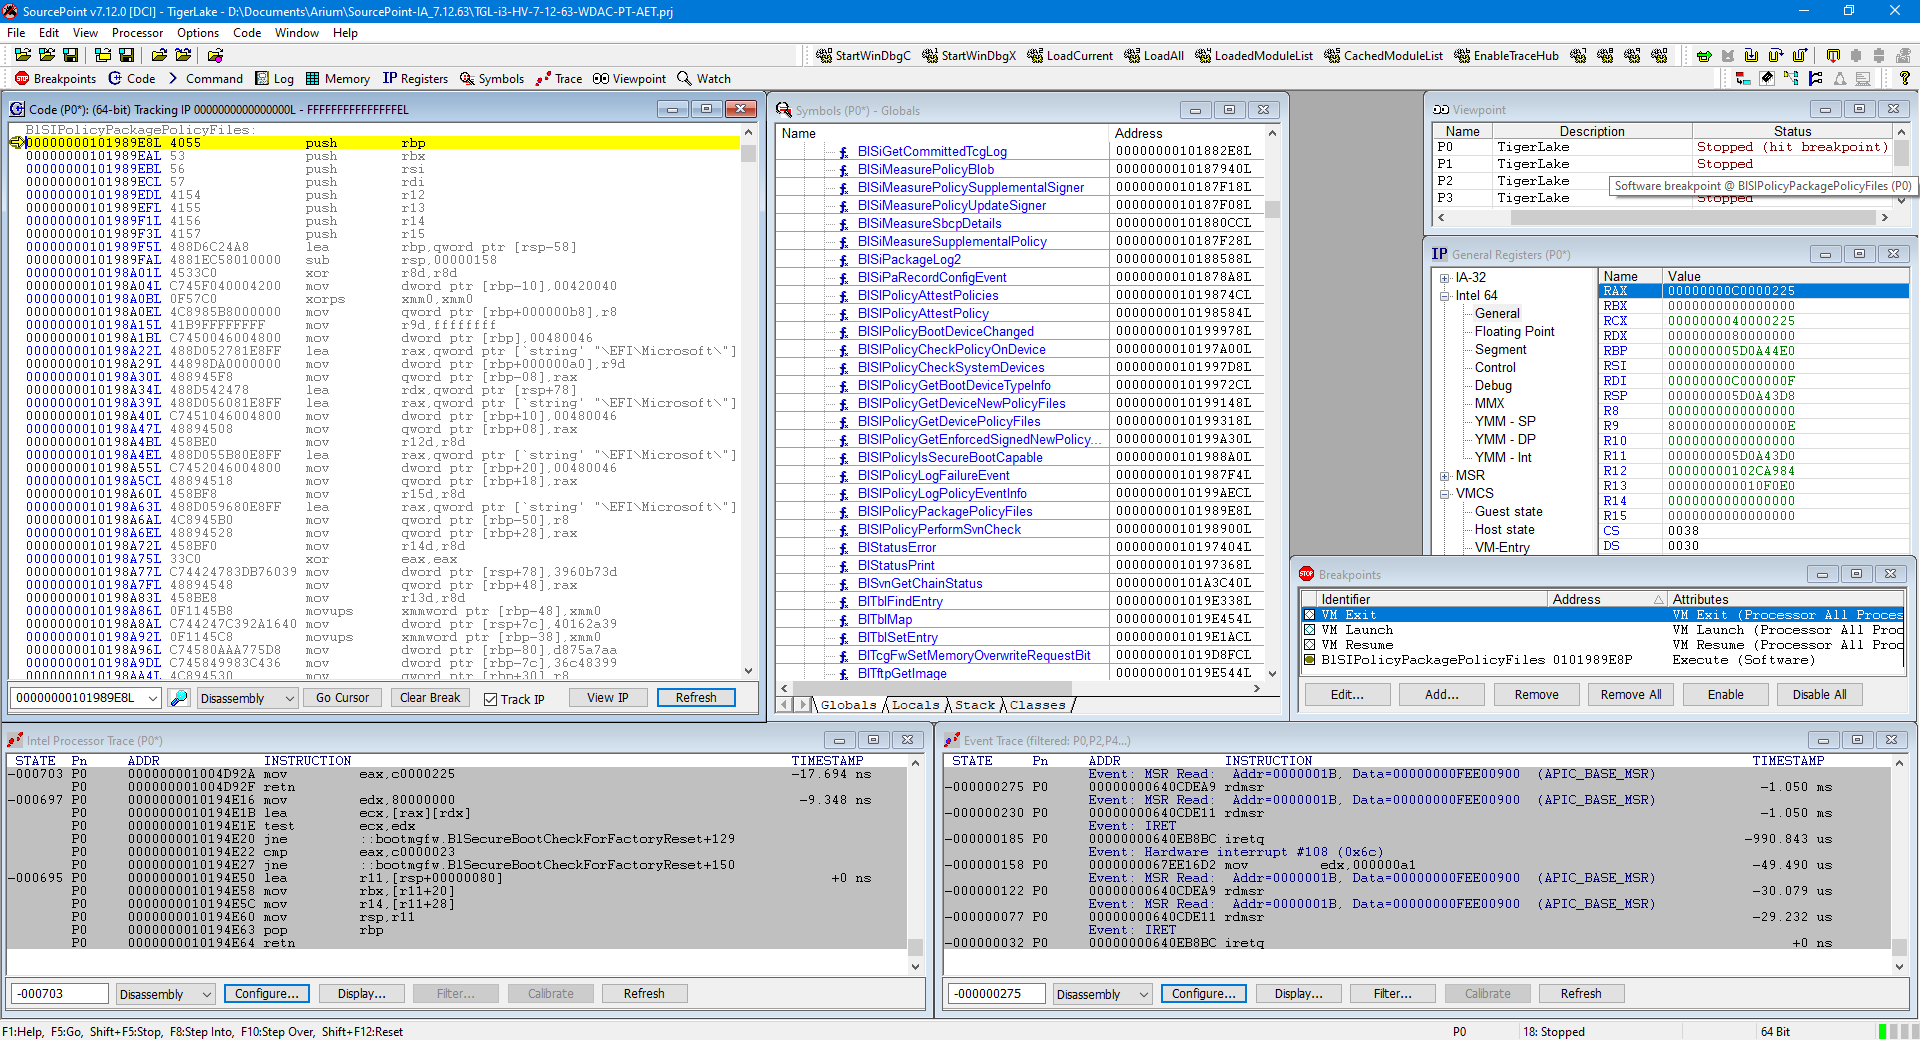
You’ll note that I’ve scrolled down a little in the SourcePoint Symbols window, so you can see the BlSiPolicyPackagePolicyFiles function and others alphabetically sorted. If you just wanted to see all references that contain “SiPolicy”, you don’t need IDA; just do a Find… in the Symbols window and you’ll find them:
And from within that window, you can right-click and set a breakpoint, open another Code window, etc.
Now, you can spend days/weeks/months using the power of JTAG to explore WDAC, in ways that far surpass those of traditional kernel debuggers (if they even worked for WDAC; and they don’t!). I’ll be diving in deep into this topic in a future article, after I’m finished my current series of blogs exploring VT-rp/HLAT on the AAEON UP Xtreme i12 Alder Lake board, as well as VBS Enclaves. But I’ll show you a little bit of what I’ve done by activating Intel Processor Trace (Intel PT) and Architectural Event Trace (AET) and doing a Go from bootmgfw.BlBdWaitForJtagHwDebugger to BlSIPolicyPackagePolicyFiles (a function of interest that Andrea mentions in his article).
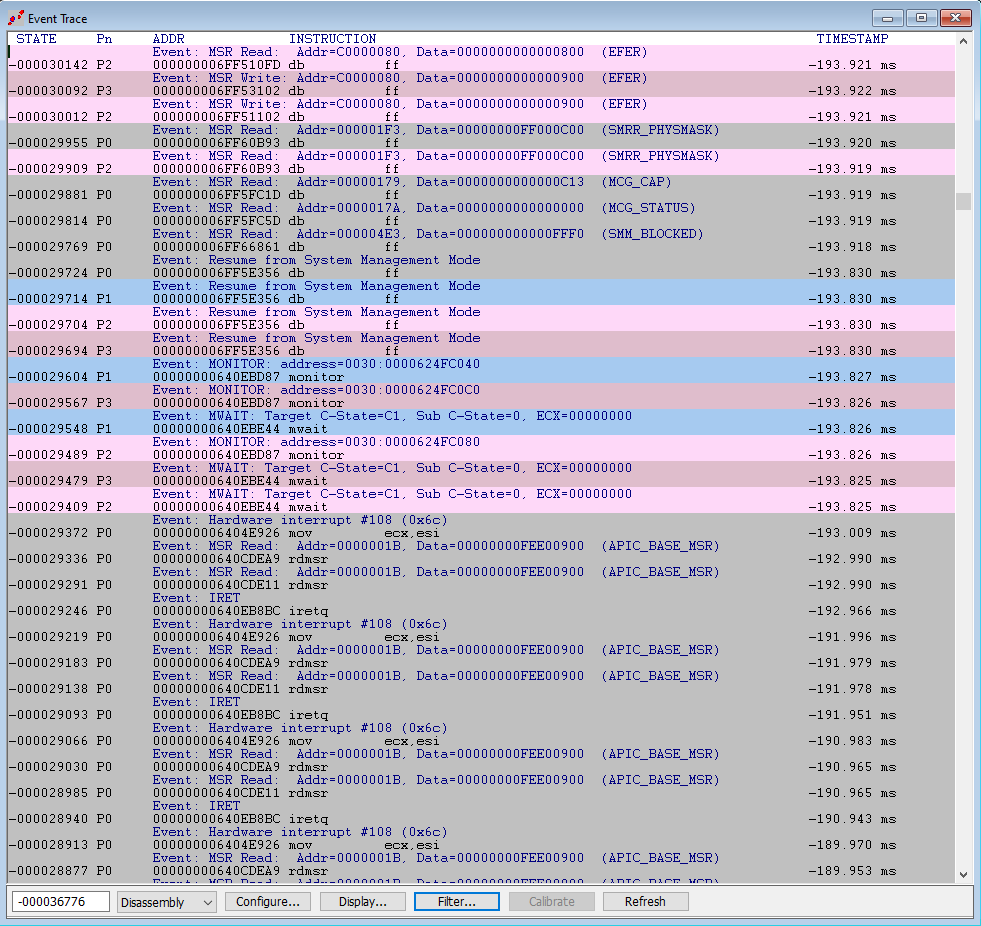
Capturing Intel PT and a bunch of architectural events shows:
Expanding excerpts of the AET and Intel PT windows show some very interesting things:
And Intel PT, using our Call Chart display to visually see where the code is spending its time:
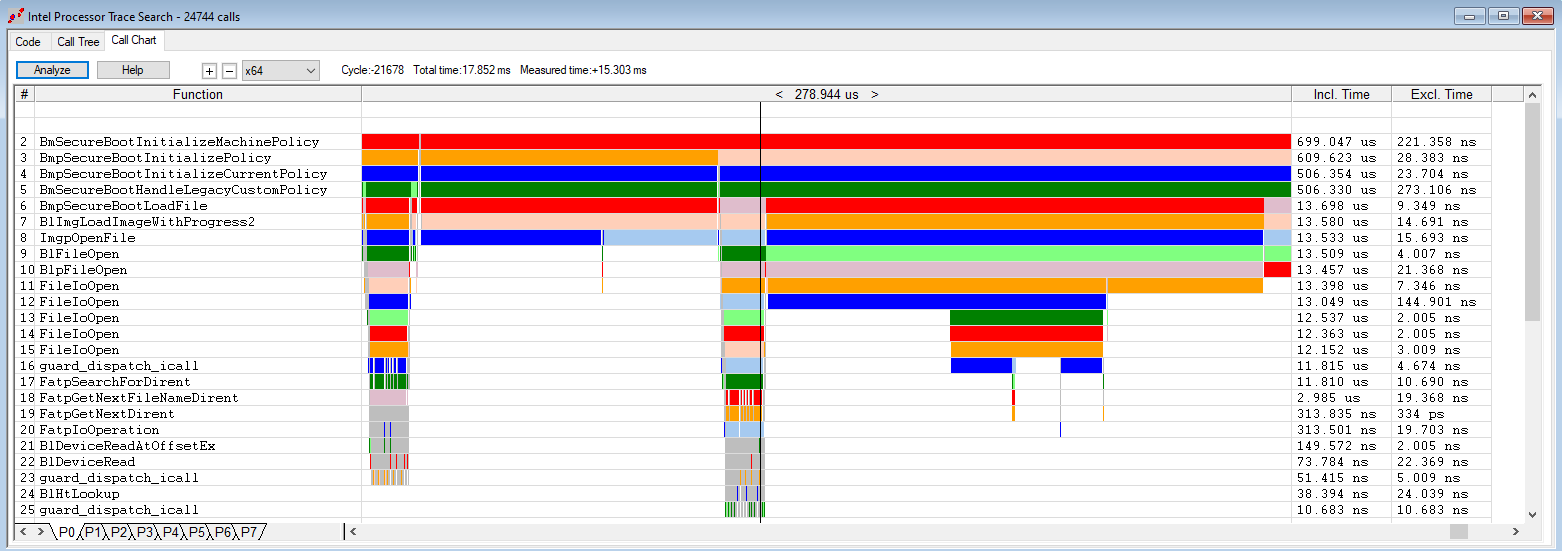
You can see, this is a fascinating topic that I could study for quite some time. There are lots of fascinating discoveries pending.
And if you’re interested in acquiring a copy of SourcePoint WinDbg for yourself, please visit our product page.