Some SourcePoint users may not know about its powerful System Management Mode (SMM) debugging features. Here’s a short tutorial on how to get started.
SMM is a special operating mode on x86 processors that is separate from the operating system, and operates without its knowledge. It operates at the firmware (UEFI) level, and as such, it represents a security attack surface, and is of special interest to cybersecurity researchers and UEFI/operating system engineers. For example, if vulnerabilities exist within the SMM firmware, attackers can exploit them with unfettered access to physical memory, registers, and devices. There have been many such attacks via SMM in the past; and in fact, some companies make a living providing security features intended to harden UEFI and SMM, including binarly.io and Eclypsium, to name a couple.
System Management Mode is very well-documented within the Intel Software Developers Manual, the most recent version of which is available here.
SMM is initiated by an System Management Interrupt (SMI), where the current processor context is saved in SMRAM, a separate and distinct memory address space. SMRAM is inaccessible to other operating modes, but it can be read with JTAG while stopped in SMM mode, and we’ll see what that looks like shortly. The SMI interrupt is handled by SMM handler code at its entry point, which when finished issues a resume (RSM) instruction, that restores context and resumes normal OS or application code.
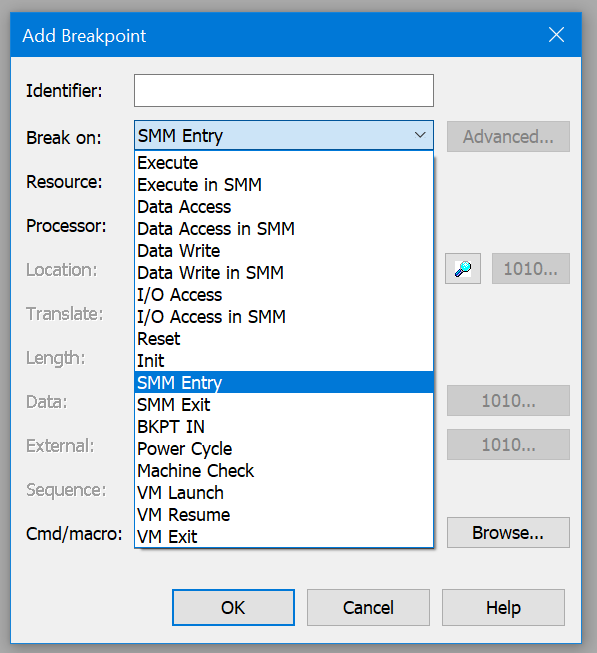
To see SMM debug in action, I booted my AAEON UP Xtreme i11 Tiger Lake board to the UEFI shell, launched SourcePoint, and did a Halt. I then set an SMM Entry breakpoint from the plethora of breakpoint choices from within SourcePoint:
Once that breakpoint is checked, you can see it in the SourcePoint Breakpoints window:
Note that UEFI boot is essentially single-threaded, so I selected P0 as the bootstrap processor upon which to place the breakpoint. As we get into Windows, more logical processors are involved, and each proc has its own SMRAM, so I could also select All Processors, or any other individual processor, as locations for the break.
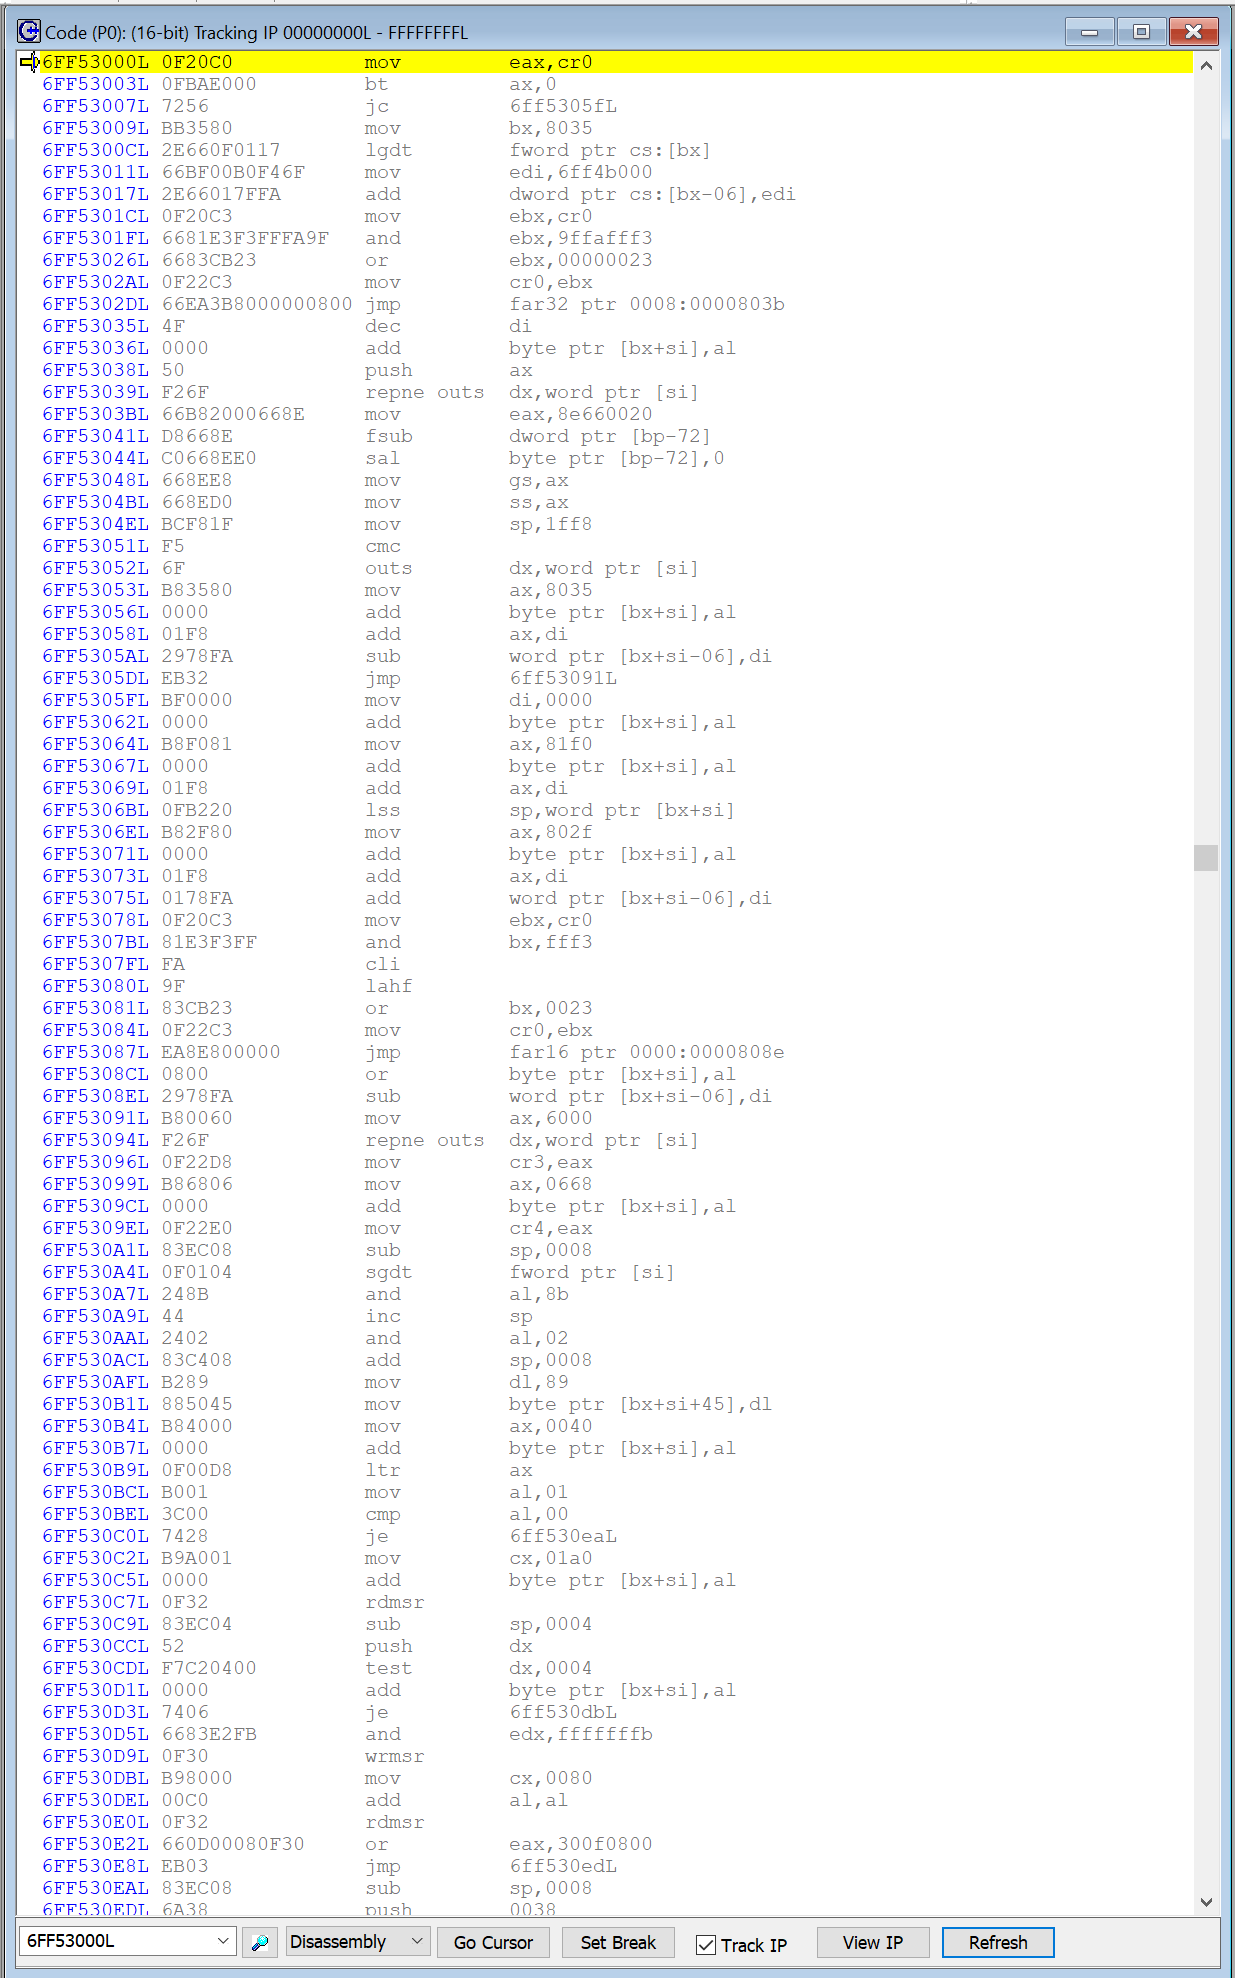
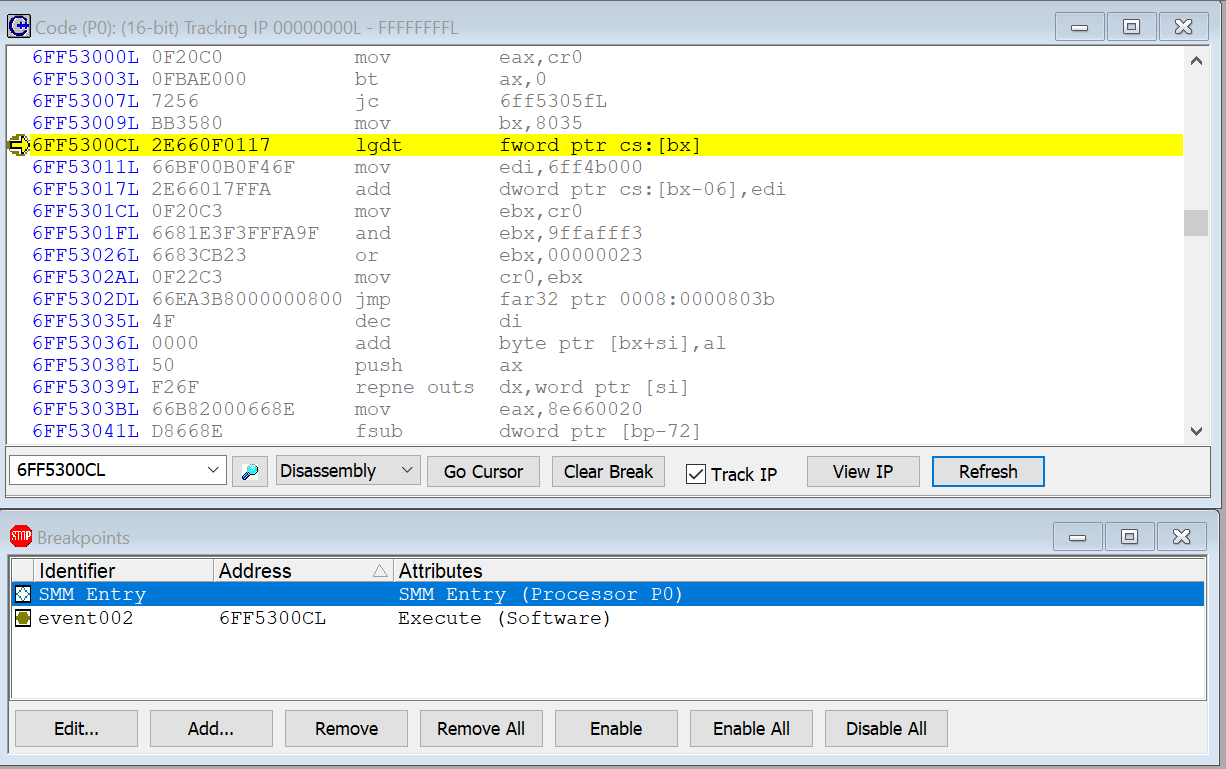
Just hitting Go on the SourcePoint debugging host, and then Enter on the target’s keyboard while at the UEFI password prompt, triggers an SMI, and the breakpoint is hit. Here’s what the Code window looks like, with the instruction pointer highlighted in yellow at the top:
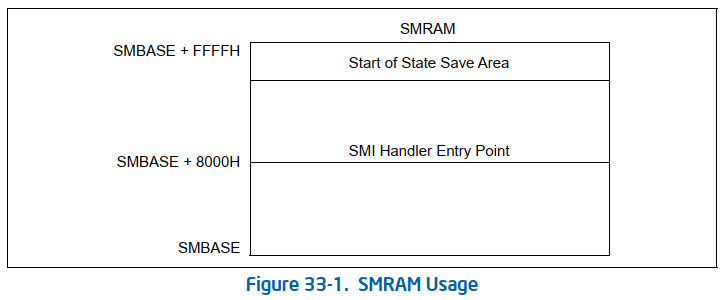
To put this into context, within the SMM chapter of the Intel SDM, the SMRAM addressing scheme is as below:
Note that the entry point for the SMI handler in the SourcePoint Code window is 6FF53000H, which is SMBASE + 8000H. Thus, SMBASE is 6FF53000H – 8000H = 6FF4B000H.
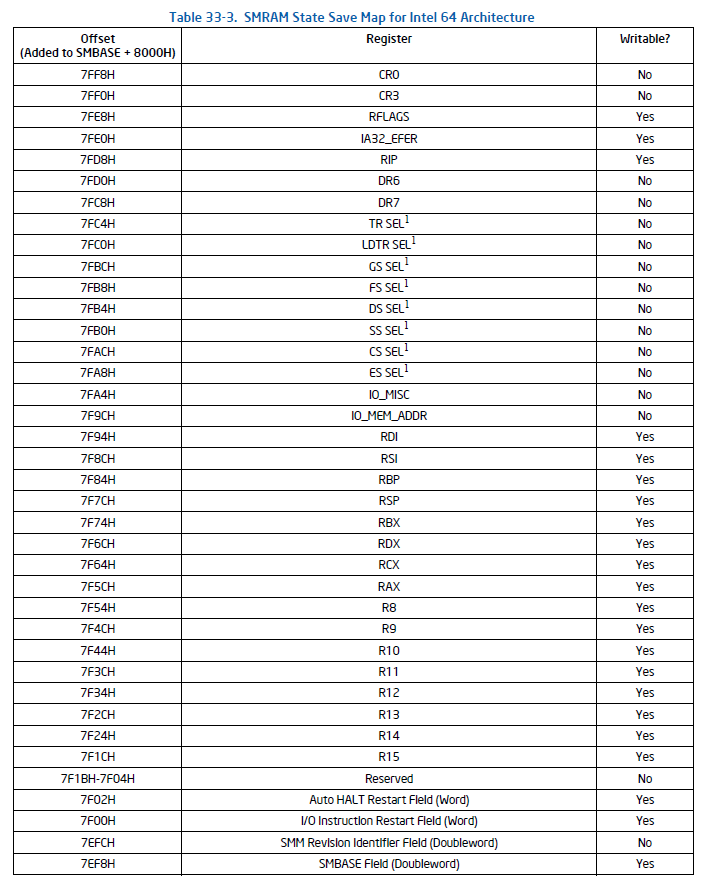
Table 33-3 of the Intel SDM (part of which is displayed below) shows the layout of the SMRAM State Save area:
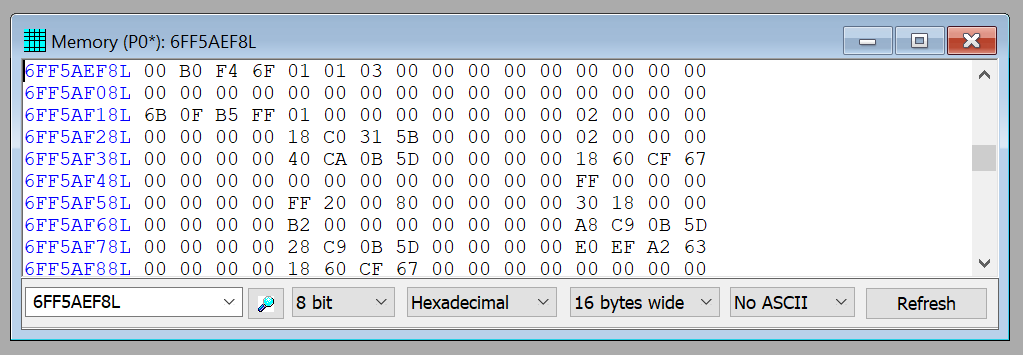
Note that the SMBASE value itself is available at offset 7EF8 below. You can use the SourcePoint Memory window to use JTAG to read the SMBASE field from address 6FF53000 + 7EF8 = 6FF5AEF8 and display it:
The value is 6FF4B000, as expected.
It’s pretty cool that JTAG can read SMRAM, isn’t it?
As can be seen from the Breakpoint selector window above, there are a number of innovative SMM breakpoints that are also supported, including:
SMM Entry

SMM Exit

Execute in SMM

Data Access in SMM

Data Write in SMM

I/O Access in SMM
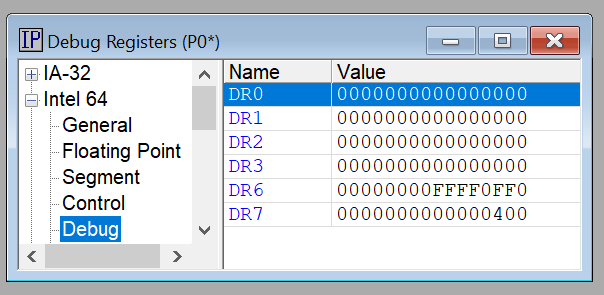
Note that the hardware debug registers are cleared upon entry and exit into SMM. This is a means to thwart regular debuggers from debugging SMM. You can see this in the SourcePoint Debug Registers window:
But, it is of course possible to use regular breakpoints within SourcePoint to debug while in SMM. Below, I’ve set a software breakpoint four instructions down below the entry point, and hit Go:
But of course, since SMM is in a separate address space, these software breakpoints do not persist across SMM Entry/Exit.
So, if software and hardware breakpoints are cleared, how do you debug SMM across different Entry/Exit?
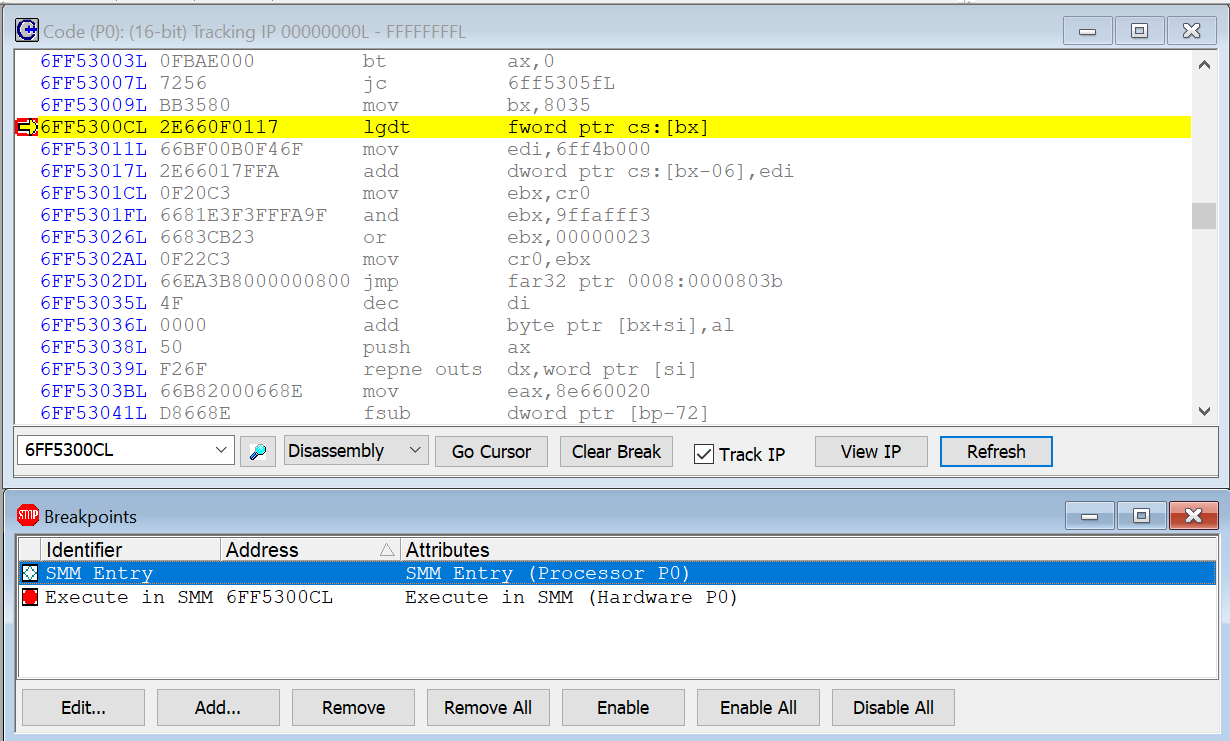
That’s what those Execute and Data “in SMM” breakpoints listed in the top screenshot are all about. The SourcePoint team realized that is possible to maintain an alternate set of debug register breaks that only hit in SMM (such is the wonder of JTAG – I don’t think that any of this is possible with any other debugger). So, as an example, I set an “Execute in SMM” breakpoint at that above LGDT instruction, and hit Go again; this time, the target exits SMM, re-enters SMM, and then halts at the LGDT instruction within SMM:
It’s almost like magic.
Interested in reading more about SMM debug? Go to Part 2 of this series, where Intel Trace (specifically Last Branch Record, or LBR) is used for dynamic analysis.


