
In Part 1 of this series on debugging SMM using JTAG, I demonstrated the use of SMM Entry and Exit breakpoints, as well as SourcePoint’s ability to set breakpoints that persist within SMRAM even across entries and exits. In this article, we’ll look at the use of Intel trace features to trace code execution (dynamic analysis) within SMM.
To understand “SMM Debugging 101”, have a look at Part 1 of this series, Debugging SMM with JTAG. It’s an introductory article to System Management (SMM) and SMRAM, the breakpoints that we can use to initiate run-control (static analysis) debug on it, and how SourcePoint uses some JTAG “magic” to set breakpoints within SMM that persist across exits and entries. I use the term magic loosely, but in some ways it’s pretty amazing: SMM clears the Intel hardware debug registers upon entry/exit, and it has its own separate memory address space, so under normal circumstances all breakpoints are disabled.
Being able to debug SMM with run-control is very powerful. Run-control means you can halt the target, set breakpoints, single-step through code, etc. But run-control stops the target at a moment in time, allows inspection of its state, and enables you to move forward in time to see what happens. But it doesn’t tell you what happened prior to the initial target halt. It’s like arriving at a car accident scene: yes, you see the car in the ditch, but what happened beforehand? For debugging, this is where trace comes in. Trace allows you to see backwards in time, to where the car hit an oil patch, slid and hit another car, and then rolled over into the ditch.
Modern Intel CPUs have several very advanced inherent trace capabilities, including Last Branch Record (LBR), Intel Processor Trace (Intel PT), Architectural Event Trace (AET), and others. Within SMM, given that it has its own separate memory space, Intel PT and AET do not work. Trying to use them will crash the target, and you’ll have to power cycle it.
But LBR does work in SMM.
What is LBR? Here’s an excerpt from a prior blog I wrote describing some of these trace features:
Let’s look at the most basic of trace features within the Intel silicon: Last Branch Record (LBR). LBR trace displays a history of executed instructions. It does this by reading designated pairs of MSRs that contain the source address (from address) and destination address (to address) for all branch instructions (such as JMP, JCC, LOOP, CALL, etc.). The advantage of LBR trace is it is non-intrusive; the processor can run at full speed when using LBR trace with as close to zero overhead as you can get. The disadvantage of LBR trace is the limited number of MSR address pairs available (for Skylake-EP, there are 32 pairs). So, if you assume an average of 5 instructions between branches, then roughly the last 160 assembly language instructions executed are traced.
LBR can be used to provide some instruction execution trace capability within SMM. It’s not as comprehensive as, for example, Intel PT; but with judicious use, it provides some amazing insight into SMM internal operations.
To see this in action, I’ve got some screenshots from debugging SMM on my AAEON UP Xtreme i11 Tiger Lake board. I’m in UEFI, at the BIOS settings password entry prompt, where only one CPU thread is running; but this approach can be used anywhere in the boot process, all the way from the reset vector to the OS desktop and beyond.
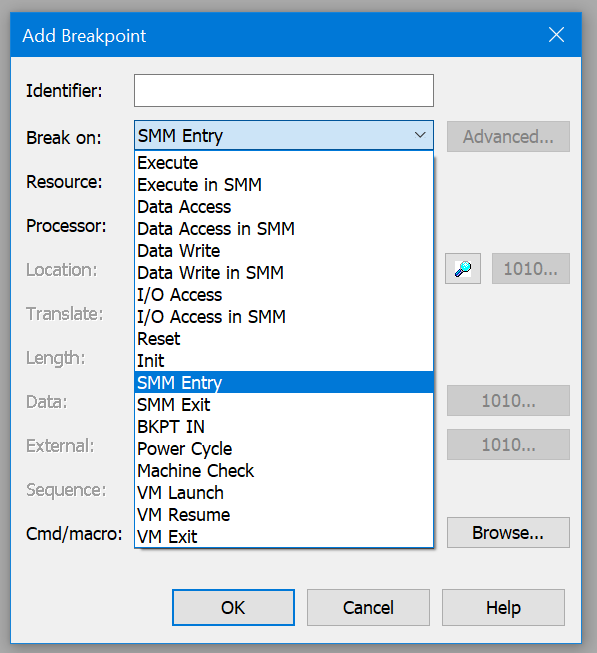
To break into SMM, it’s a simple matter of setting an SMM Entry breakpoint using SourcePoint’s breakpoint selector:
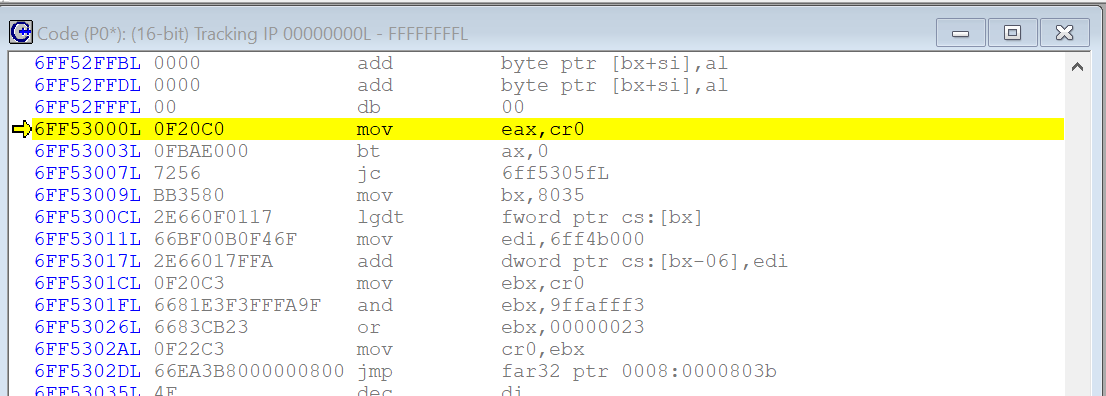
Hitting Go takes you to the SMI Handler Entry Point:
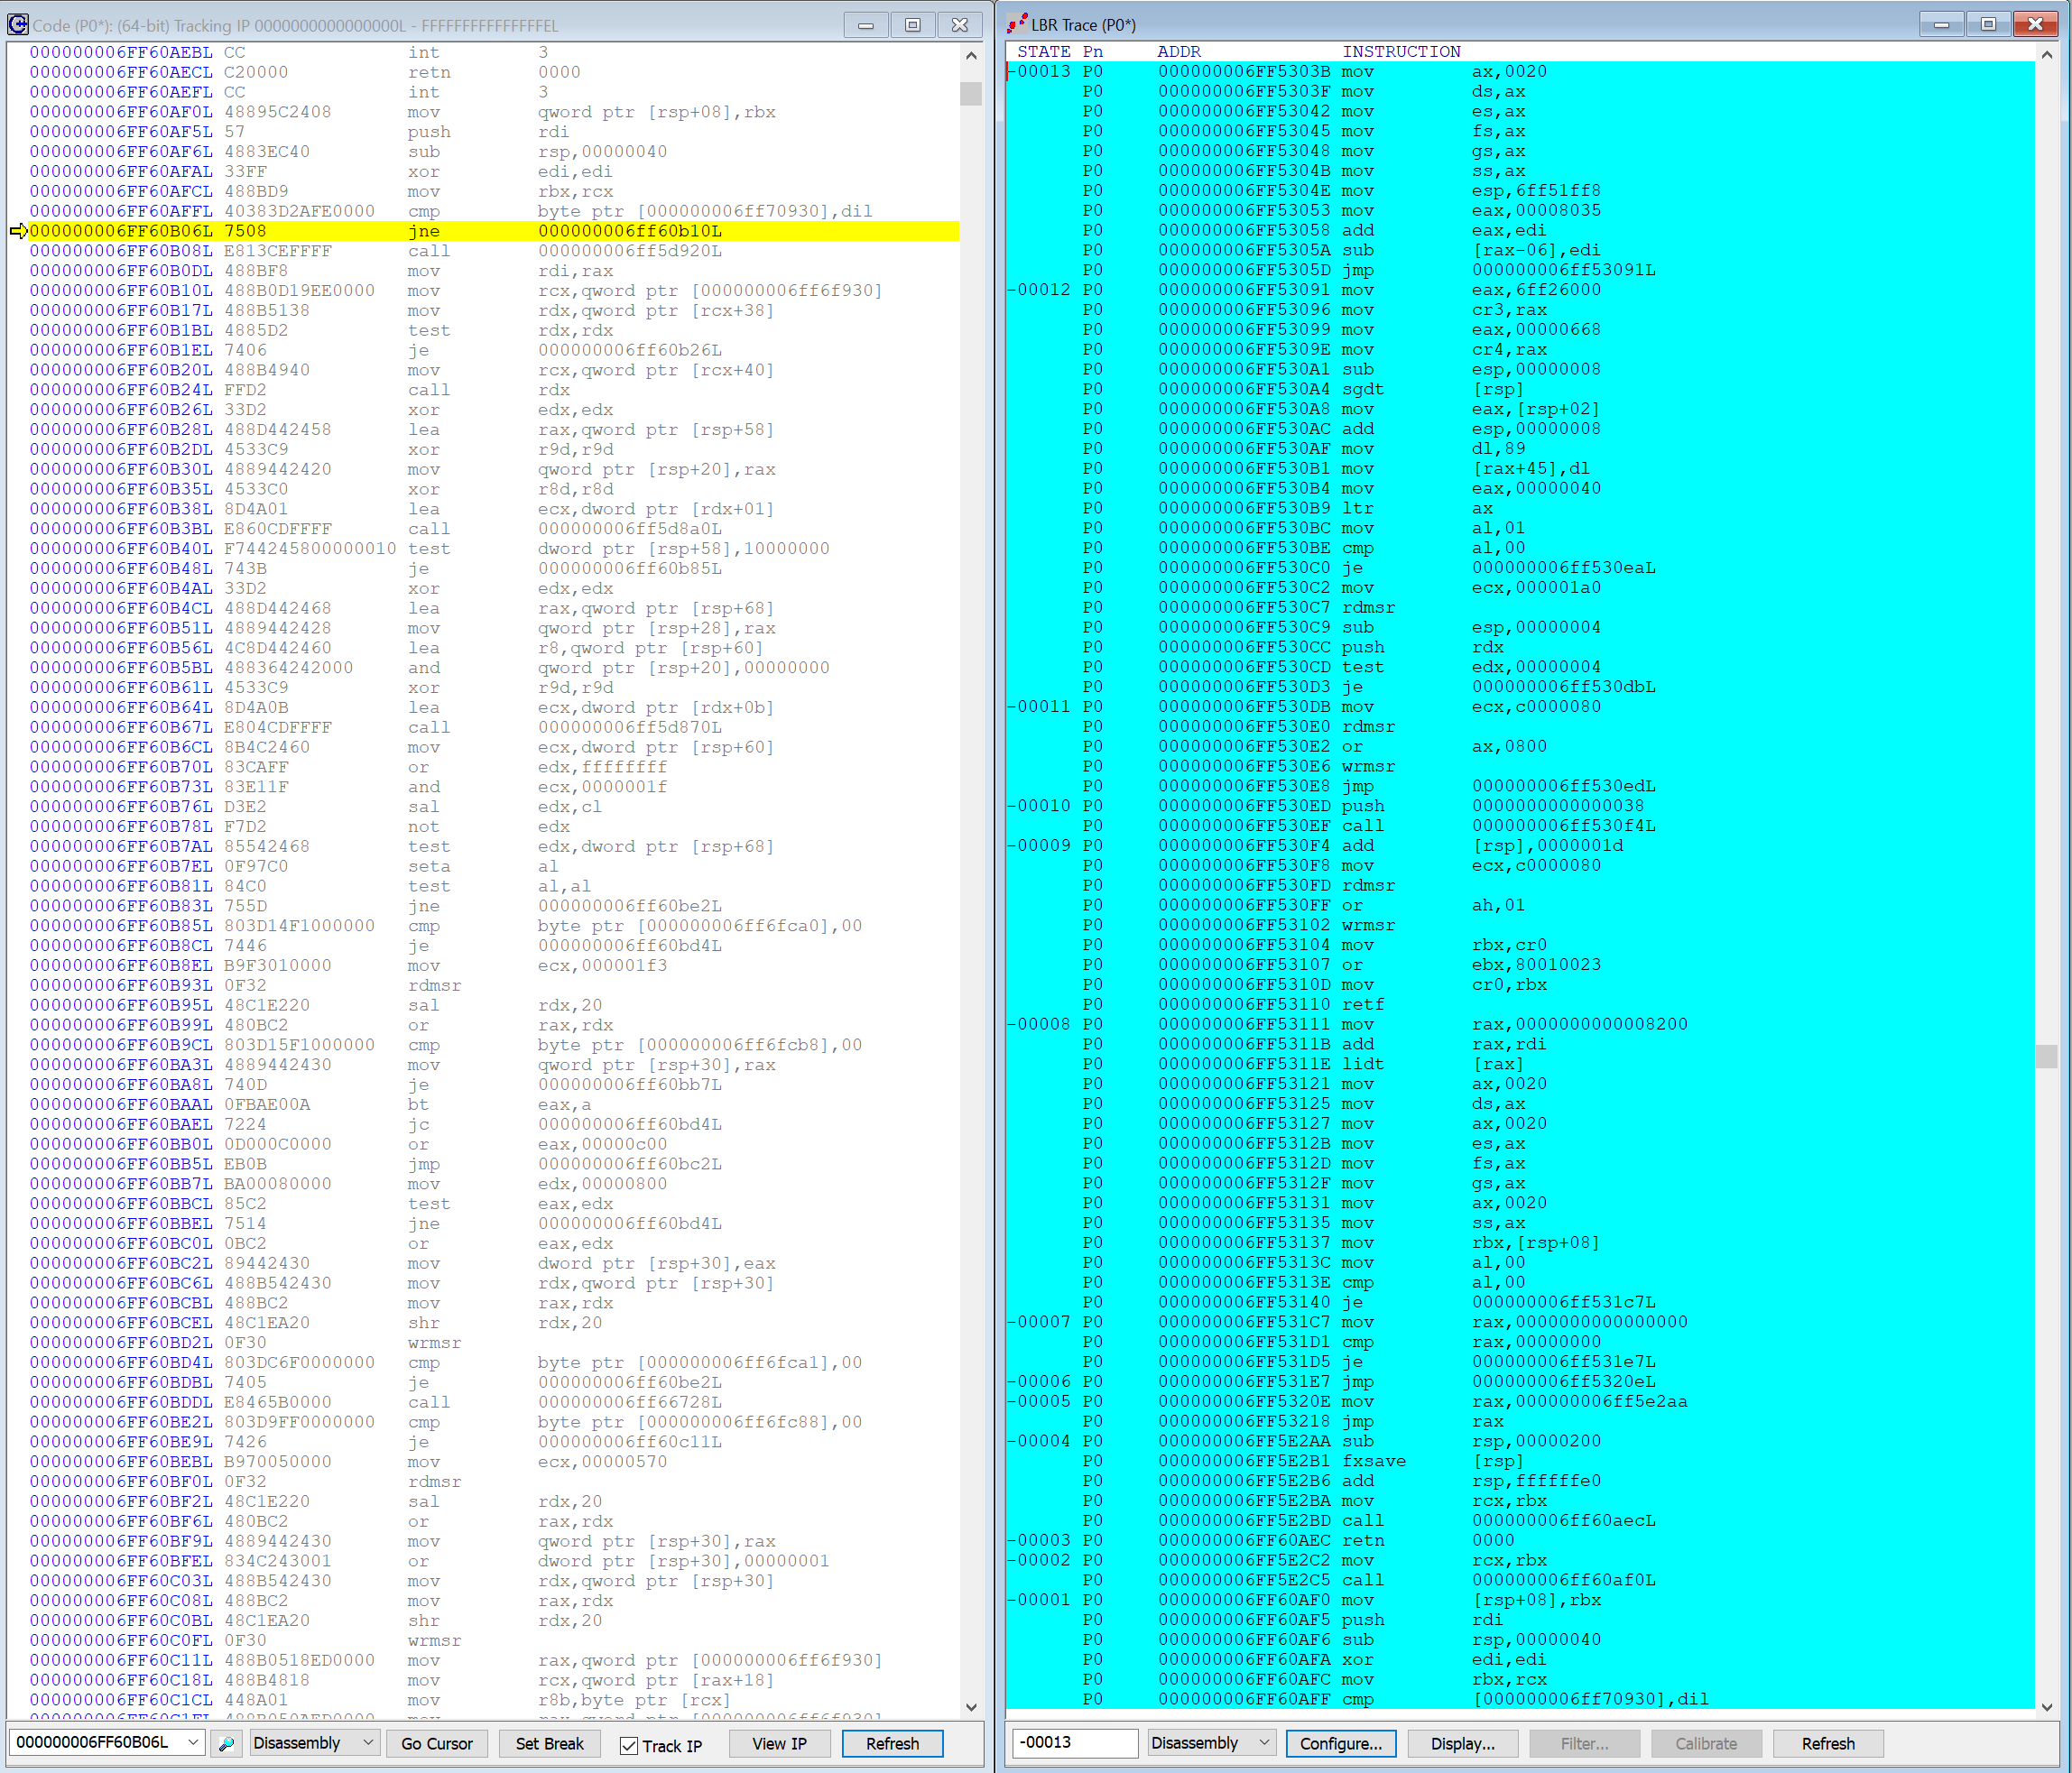
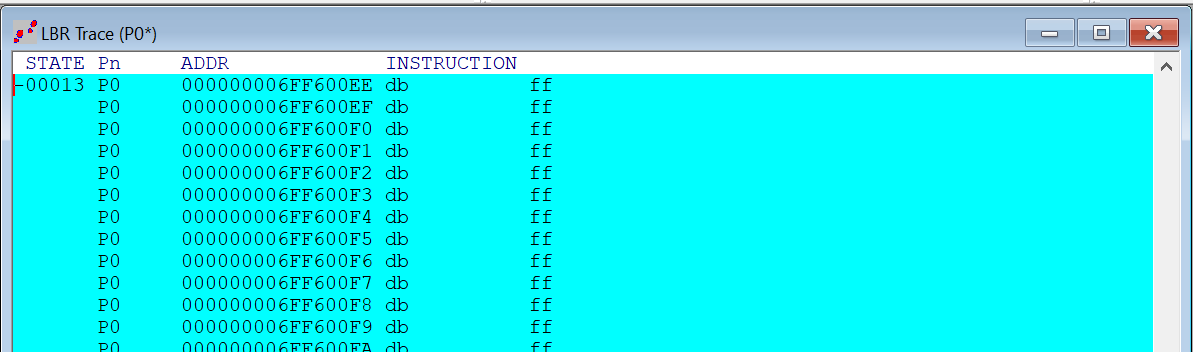
From there, you can turn on SourcePoint’s LBR Trace feature, and halt anywhere in SMM. Here is a screenshot of the Code window and the LBR Trace window display where we are in the code, and how we got there, all the way back to the first branch instruction that triggered the write to the 1st LBR MSR pair:
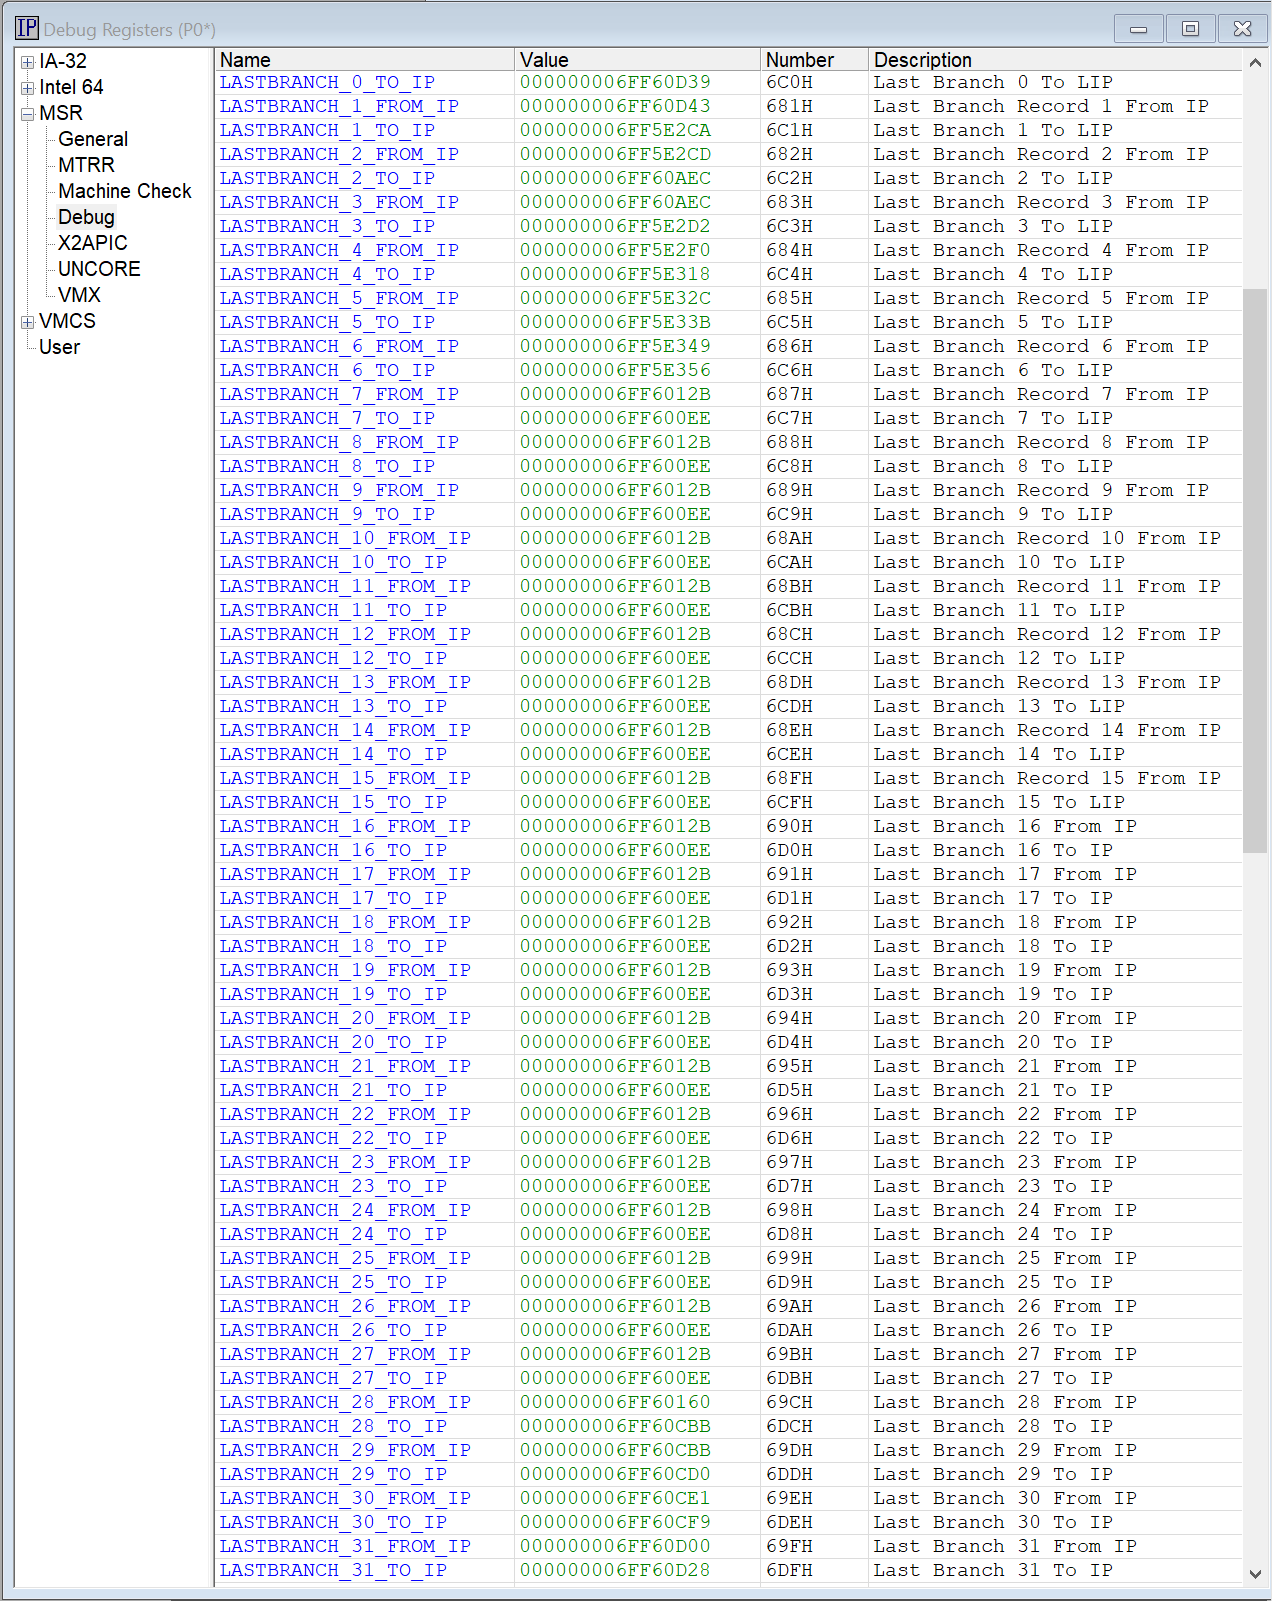
And for interest’s sake, you can use SourcePoint’s Register window to inspect the 32 To/From LBR MSR pairs to see how the addresses are tracked:
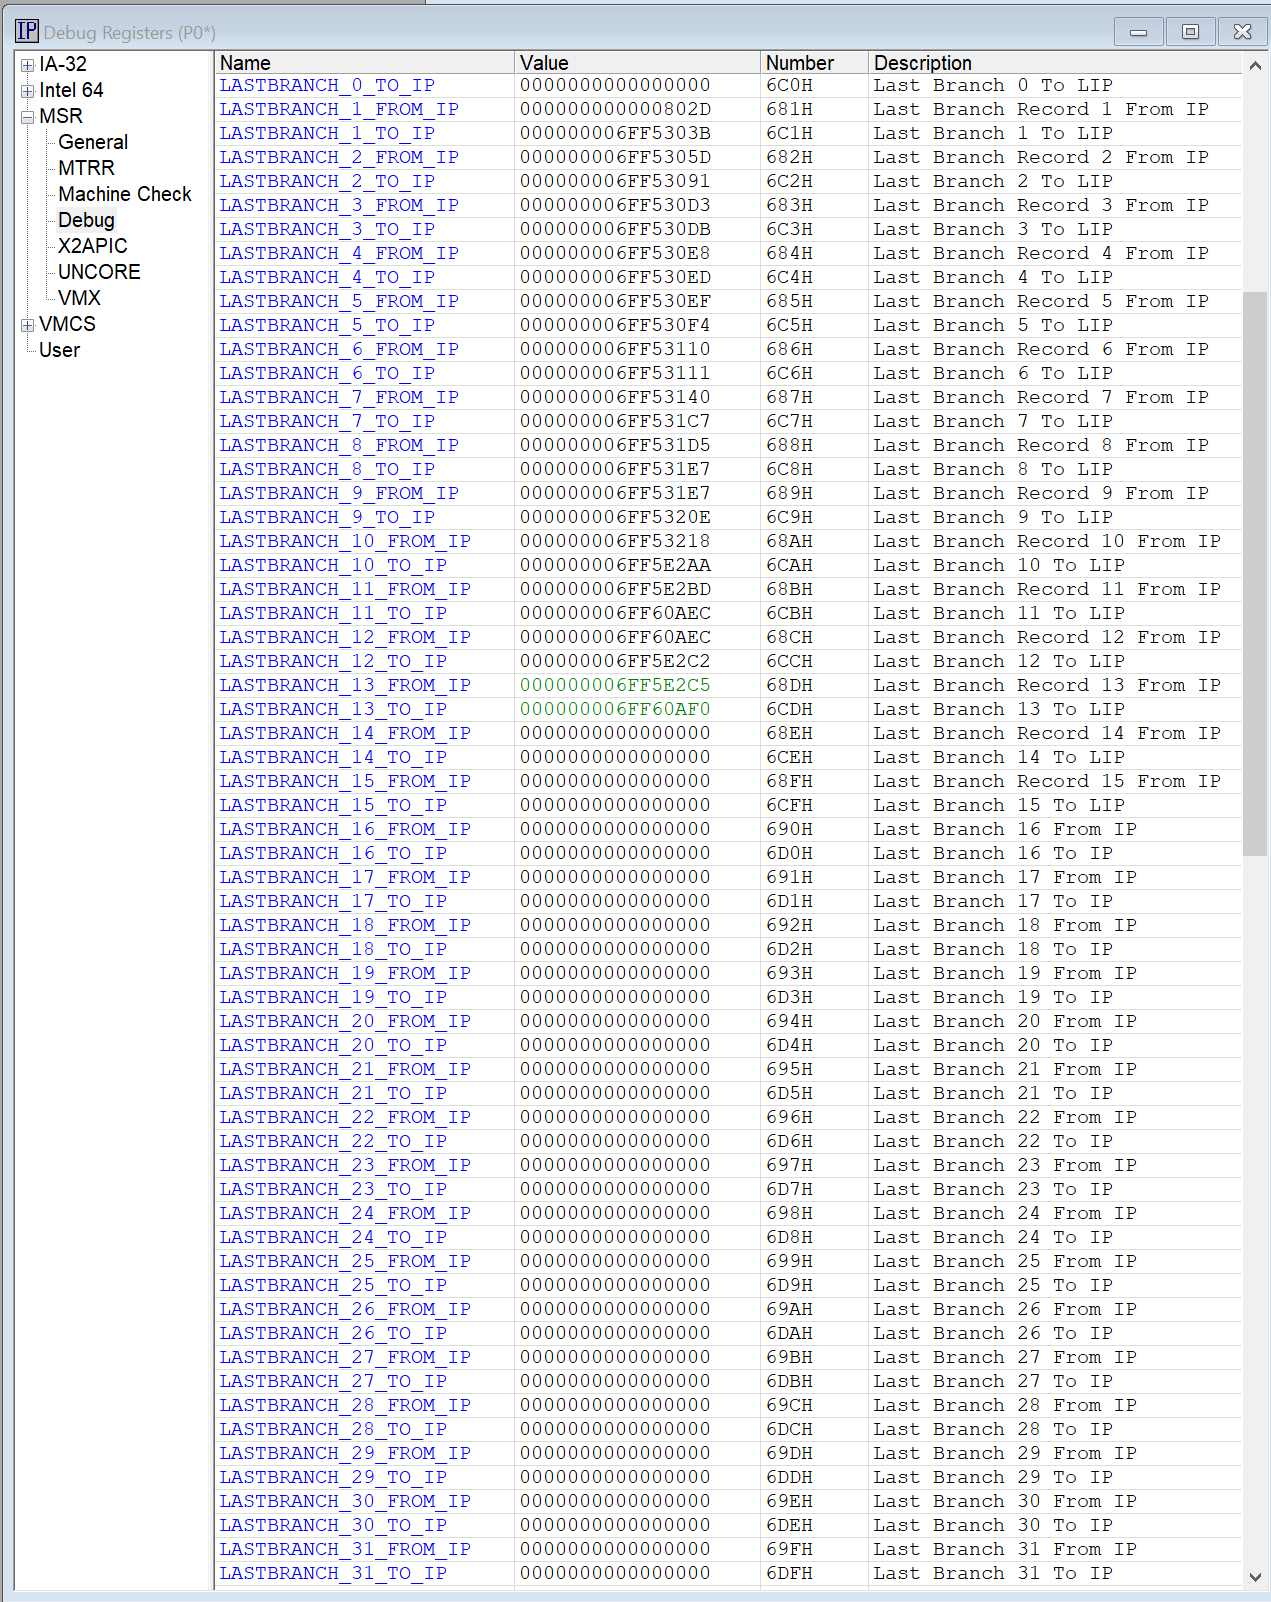
You can see that the last branch pair written to were at LASTBRANCH 13 (SourcePoint highlights the last change in green above), that captured 83 instructions (if I counted these correctly). So, in this example, with all 32 MSR pairs, we should be able to trace about 32/13*83 =~ 200 assembly language instructions using LBR. Of course, your mileage will vary depending on how many branches are done in the code you are inspecting before filling up all 32 MSR pairs.
Note that you can’t just the run to an SMM Exit breakpoint from there and expect to collect more LBR trace. Across an SMI transition, you have problems disassembling trace from the mode you switched from. At an SMM Exit, you’ll have switched back to the normal memory space and won’t be able to read SMRAM to do the disassembly, so you’ll just see garbage:
A final tip for dyed-in-the-wool SourcePoint users:
On your first SMM Entry break, all the LBR MSRs are zeroed out, so LBR trace just works immediately.
But on the next Go, when you hit the SMM Entry breakpoint again, all the LBR MSRs will be filled up from previous branches. For example:
What you want to do is zero out the contents of these MSRs, to be able to collect fresh LBR trace. Doing so manually can be quite tedious, because there are of course 64 registers to clear. An easy way to address this is to use the built-in SourcePoint Command language, and create a small macro:
define proc clearLBRs()
{
define int i
for (i = 0; i < 32; i++)
{
     msr(680 + i) = 0;
     msr(6c0 + i) = 0;
}
}
From the File menu, type in Load Macro… and use that to load the macro into memory. Then at the Command line, type in clearLBRs() and watch the LBR MSRs correctly zero out. Then you’ll be able to get some clean trace.
Editor’s Note #1: you have to do this because LBRs work by default in “Append” mode. We’ll be adding in an “Overwrite” mode to clear out the LBR MSRs automatically in a future release.
Editor’s Note #2: you can see in the MSR Registers window that, for the Tiger Lake board, the From MSRs run from address x’680 to x’69F, and the To MSRs run from x’6C0 to x’6DF. Note that starting with Alder Lake, Intel moved to an “architectural MSR” approach, and the addresses changed. For the UP Xtreme i12 Alder Lake board, delete the lines:
     msr(680 + i) = 0;
     msr(6c0 + i) = 0;
and replace these with:
     msr(1500 + i) = 0;
     msr(1200 + i) = 0;
     msr(1600 + i) = 0;
In a future blog, I’ll be writing more about SMRAM, and how to use SourcePoint’s Device View to create a visual depiction of the SMRAM Save State Area and watch it change as you use run-control and trace with SMM entries and exits. It’s fascinating.
To finish up: are you an individual hobbyist or researcher who would like to use SourcePoint for non-commercial purposes (i.e. reverse engineering, cybersecurity research, learning)? If so, check out our less expensive SourcePoint Home license at our website Online Store.