In my last few blogs, I’ve looked at the use of Intel Trace features for capturing valuable debug information. In particular, Architectural Event Trace (AET) and Management Engine (ME) message trace are very powerful capabilities. This week, we put these trace events in a meaningful code context by correlating them with Intel Processor Trace (IPT).
If you’ve gotten to this paragraph, I’d like to say Congratulations! You’re probably one of a very small number of people who are familiar enough with x86 architecture and firmware development to actually find this interesting. And becoming proficient in these areas takes, in my not-so-humble opinion, years of experience.
Well, enough of the flattery; let’s look at why we should be interested in combining AET capture and Intel Processor Trace. Starting at the beginning, we should consider the difference between static debug and dynamic debug, borrowing from Larry Traylor’s Intel Trace Hub eBook:
Static Debug: This type of debug involves stopping program execution at some point by means of either a breakpoint or as the result of a step. The engineer then examines the program object values in that state. These program objects, which are accessed either directly or indirectly, are the processor registers, memory values and other hardware registers within the system. This type of debug is quite adequate for code walking and for easy-to-find root causes, when the system is run as a whole and where the coding error is near the symptom in address space and execution order.
Dynamic Debug: This type of debug uses some method to record the execution of a program while it is running and, after the experimental examination of the results. This is Trace. In most modern application processors, for practical reasons, this is often limited to the instructions executed and not the values (data objects) that these instructions operated on. This experiment often ends in stopping the execution, but this is not required and not always possible. Dynamic debug is the only effective method of finding the root cause of bugs found during platform stress testing. This type of bug involves a flaw or failure in a running system.
The most challenging bugs are often due to asynchronous events, and static debug is often not adequate for root-causing these. Recognizing this, Intel added Processor Trace capability to its silicon. The problem here is that most modern processors will place millions, billions or trillions of lines of code into an instruction trace buffer. The instruction flow must be correlated to an event of interest for debug triage to be effective.
And this is where instruction trace and event trace come in. We’ll look at a hypothetical example where we suspect a bug associated with how we are handling interrupt returns.
Luckily, we have a number of interrupt and exception handling event trace capabilities within AET. I’ve checked them all, just for completeness:
We also have to set up the Intel PT configuration and Intel PT memory configuration (to set up where in system memory we’re going to place our instruction store):
We then run through some code, and break:
This is truly a work of art. Let’s look at each of the windows in turn.
The window at the bottom right is the Event Trace window. You can see that we captured an Interrupt event (#104) that maps back to iolibmsc.c at line 198. At 23.659 microseconds earlier than the halt we issued, at address 67AFF8B6 there is an ADD RSP, 20.
When we click on that instruction in the Event Trace window, the Tracking Trace code window at the top right jumps to that address. You can see the same ADD RSP, 20 instruction there.
And the Intel Processor Trace window at the top left shows that, yes, indeed, we’ve captured the same instruction in the instruction flow. We can now backtrack on the instruction trace to see what happened prior to the capturing the Interrupt event.
And this is where it gets fun: if we right-click inside the Intel Processor Trace window, and click on Open Trace Statistics Window, and then hit Analyze, we get a very powerful profile of the function calls, including Incl. Time (the total execution time in this function, including child calls) and Excl. Time (excluding the child calls):
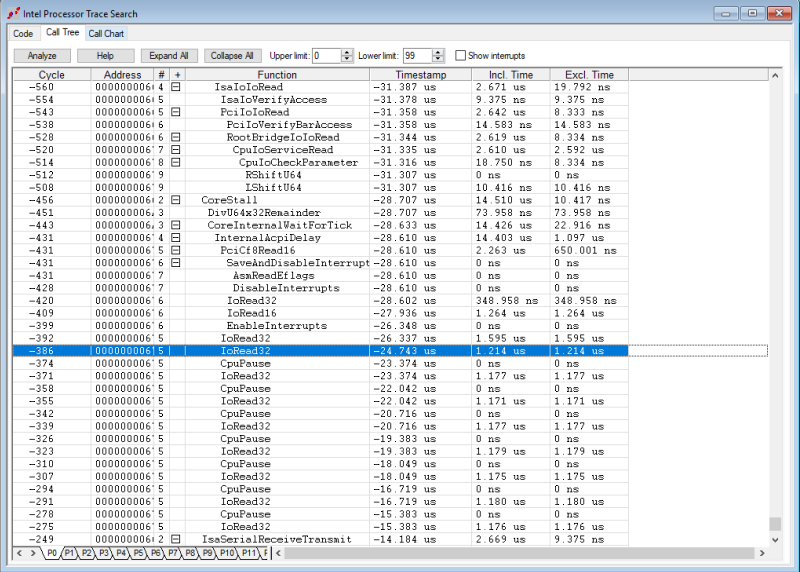
Right-clicking and selecting Open Trace Search Window gives you a nested Call Tree:
This is absolutely amazing (at least to me). These are the trace features that, in conjunction with basic run-control (halt, go, breakpoints, single-step) provide tools for engineers to debug the most difficult, intermittent problems.
There's more to show (wait until you see the Call Chart), but I've run out of time for now. More later!


