SourcePoint for Arm Trace
Home / Products / SourcePoint / SourcePoint Arm Trace
About SourcePoint Arm Trace
Clear Insight to code interactions brings products to market on time and within budget. Tracing code execution at the micro or macro level is the only way to determine complex software bugs root cause quickly. SourcePoint enables the user to take advantage of whatever CoreSight trace components are available by auto target acquisition. Then providing clear views into the code (data) captured on the silicon and presenting or displaying the information concisely. SourcePoint allows the user to configure the views with the right amount of information to gain rapid correlation.
Mining Arm Trace Data
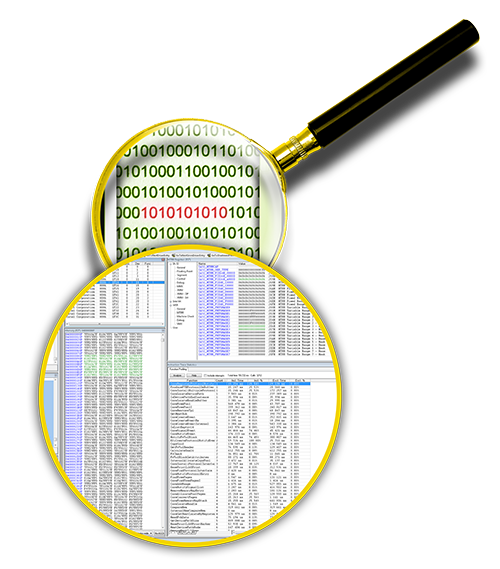
Once a problem has been located at the system level, drilling down to examine the potential cause, requires clear and insightful views. With an ARM processor, that has multiple cores and multiple PTMs, it is sometimes desirable to have the trace capture all the PTM data from each of the cores.
Code developers need flexibility to examine code running on specific cores while making trace measurements to capture core-to-core interaction. SourcePoint is designed to handle the needs of the developer by providing views that correlate trace data to a code view running on one core while also tracking code on yet another core.
Arm System Trace Macrocell
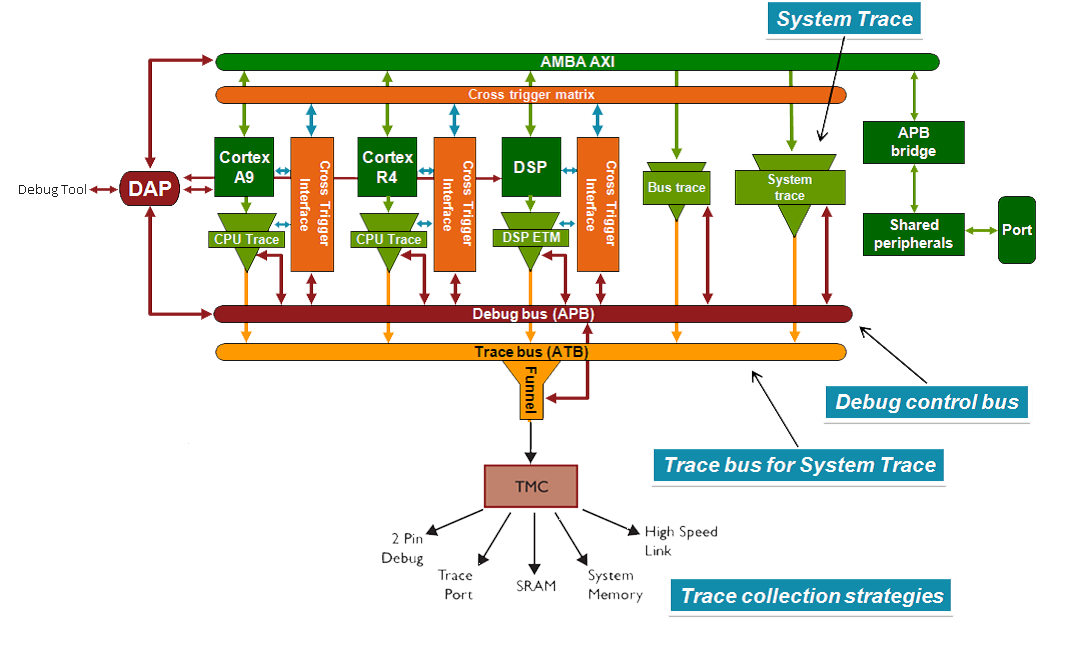
System Trace Macrocell (STM) is a trace element which, when integrated into an Arm CoreSight trace structure, can provide messages or events with data, to trace changes in the state of the system.
STM allows for several types of trace messages to be added to a trace stream. This trace stream may or may not also contain instruction flow trace streams. Thus opening up the code execution and data values to visibility at a system level never before seen except via slow-intrusive-printf statements.
SourcePoint with System Trace Macrocell
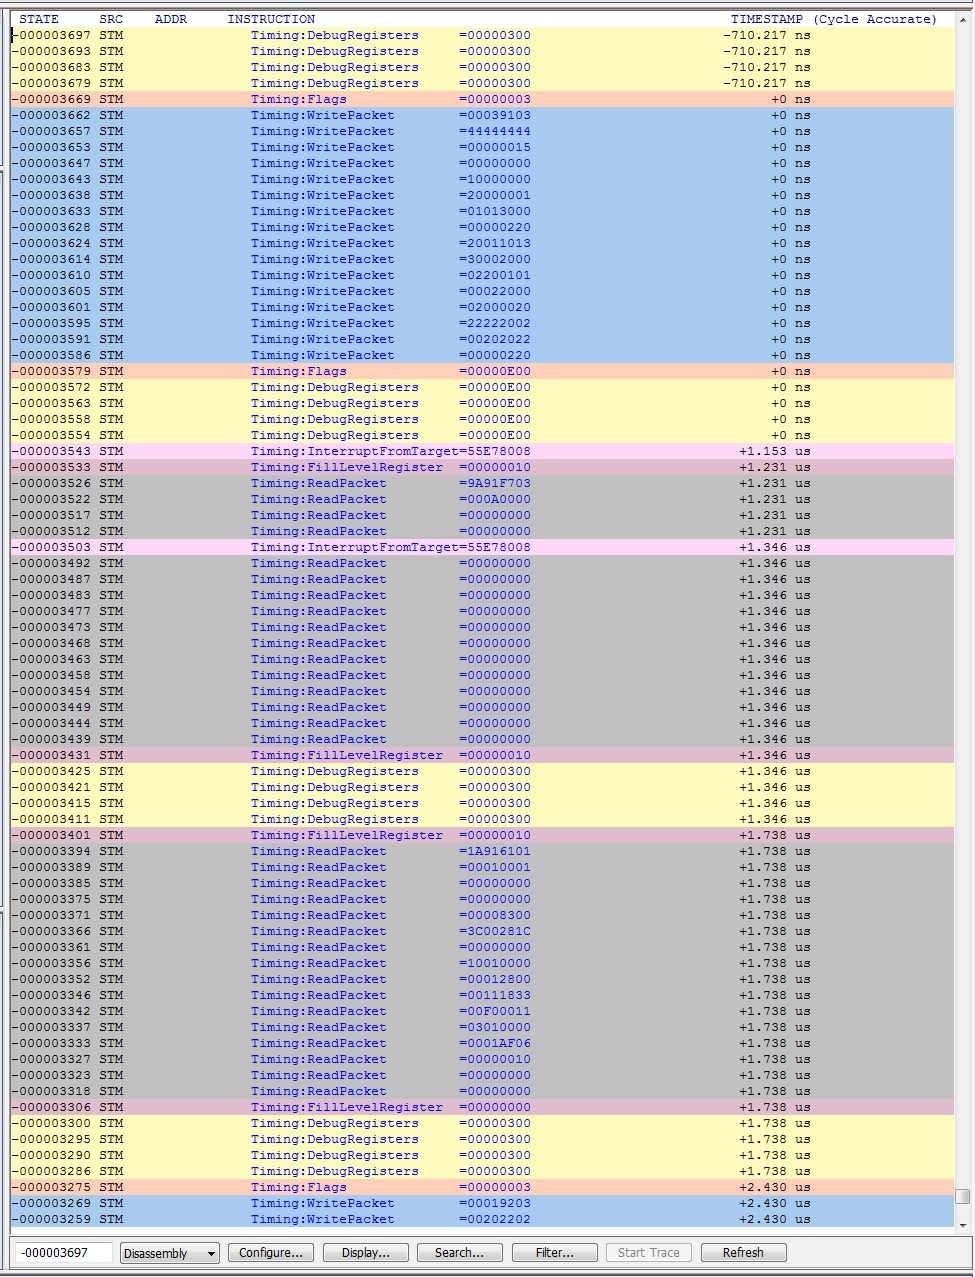
In the case of Arm, what better feature than STM to capture system level events. Code instrumentation allows for the capture of macro events with data showing the progression of events that manifest the bug. Unlike printf, STM uses packets that are decoded by SourcePoint on the debug host. This implementation requires minimal instrumentation of the code and all display types are handled in an editable XML file.
SourcePoint supports STM so that a developer can look at the system in total and extract data in real-time. An example of this could allow for the tracking of register data on an FPGA, look at packet outbound data between two end points, FIFO status, ISR status, inbound data packets. All of these transaction can be color coded based upon master and channel. Thus SourcePoint Trace with STM provides powerful, clear, precise visibility into real-time code and hardware interactions.
Arm System Level Views
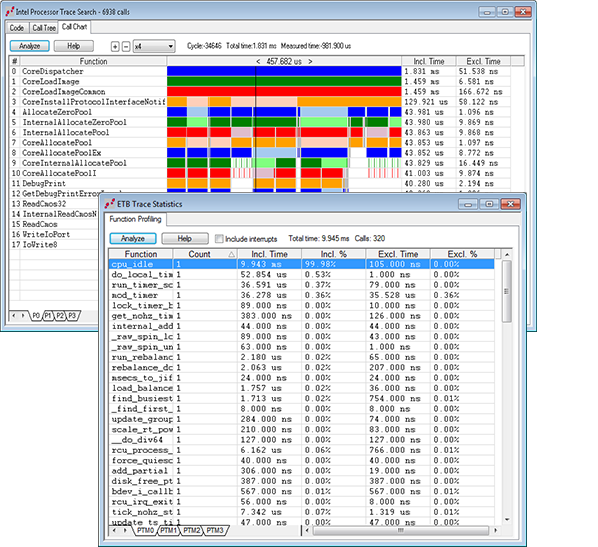
SourcePoint provides the ability, within trace, to extract PTM data in a graphic form to quickly examine system code execution. Thus, providing a graphic model of the code flow by following the function calls. With inclusive and exclusive time stamps, SourcePoint provides rapid insight to function performance issues.
If performance is a concern, SourcePoint also provides, via trace, a Statistics chart by function profiling. Again, providing flexibility in examining data from different views, all to gain rapid, yet concise views of code execution.
Related Products
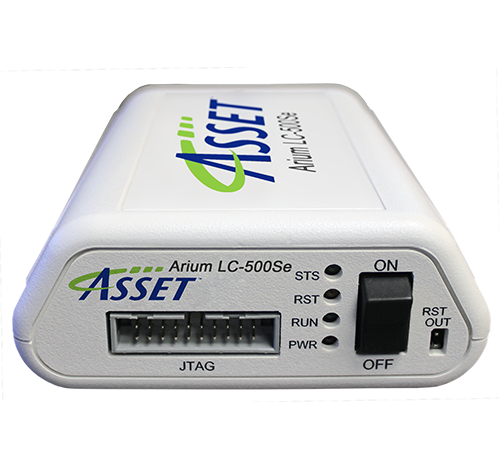
ASSET SourcePoint debugger products are designed to make the developer’s job easier. We have worked with Intel for over fifteen years, providing tools that are feature-rich in both hardware and software, making it easy for the user to accelerate development time. An example is UEFI development, where we provide macro files that allow for context-sensitive debugging in the PEIM, DXE and other boot phases.
Our tight integration of hardware and software for Arm JTAG-based debug lends itself to a robust development environment, helping to minimize the challenges associated with debugging code.

