
Using Intel Processor Trace with JTAG over a DCI connection (i.e. no expensive hardware pod) to debug a Type 1 hypervisor.
Three months ago, I took the Hypervisor Development on UEFI course, hosted by Satoshi Tanda. It was a fantastic learning experience: five intense days of deep learning on the inner workings of x86 architecture, UEFI, and hypervisor technology. I highly recommend it to anyone interested in understanding the low-level “bare metal” fundamentals of technology that we use everyday. For cybersecurity researchers wanting to hone their skills, it’s a must.
In the class, we had hands-on experience with Satoshi’s Type 1 hypervisor. This is a full-fledged, quality-tested UEFI-based implementation that is developed with EDK2 and debugged with GDB. Because of the remote nature of the class (editor’s note: I see that the next class may be face-to-face in Berlin in February – I would really like to take the class again, but in-person), we ran the hypervisor on VMware Workstation 16 Player on our own PCs. This had the advantage of flexibility – no external hardware was required, and everything could be set up quickly and efficiently, on a “virtual target” – but it lacked the real-life experience of working with a real Intel platform. So, it “virtualized the virtualization experience”, so to speak. In future classes, Satoshi will revert to using real hardware. I’ve taken it upon myself to go through parts of the course again on my own, but this time on the AAEON UP Xtreme i11 as a target.
Being a debugging fanatic, though, I’ve decided to use SourcePoint, in conjunction with the inherent Direct Connect Interface (DCI) access capability of the UP Xtreme i11, to debug it and learn the ins and outs of hypervisor technology.
If you’re interested in the background on JTAG and DCI on this board, and some of the debug and trace features available, I’d recommend watching the video JTAG/DCI Debug on the UP Xtreme i11. A more in-depth treatment on setting up SourcePoint to work with the board is here: SourcePoint Getting Started Guide for the UP Xtreme i11. We’ll skip the details of setting up here, and jump right in to working with the hypervisor.
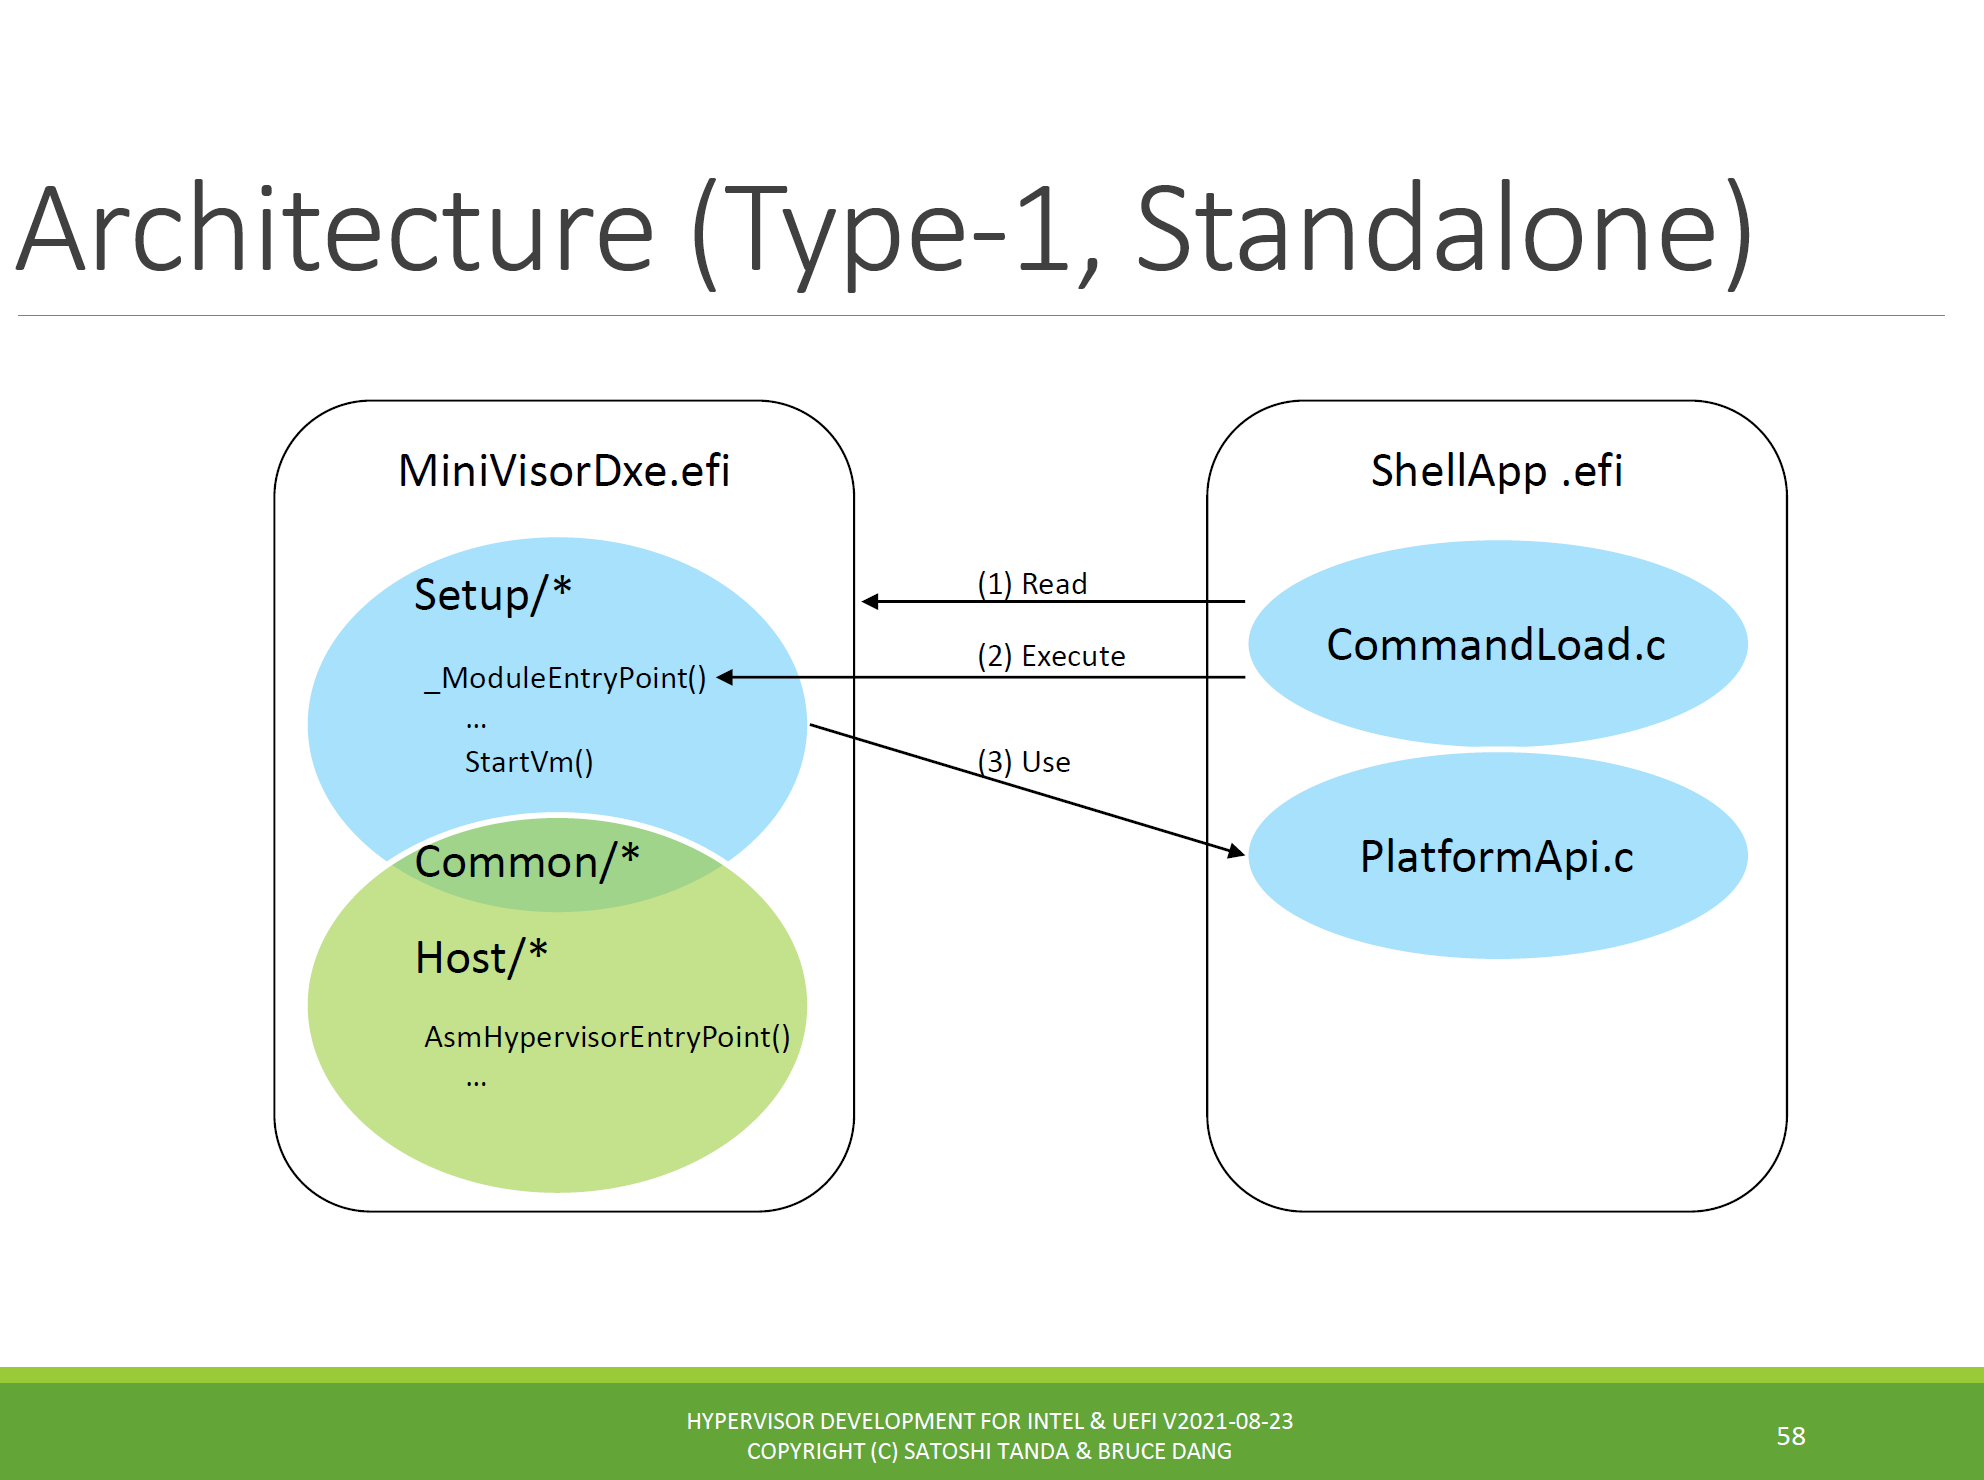
Satoshi’s hypervisor can be created as a Type 1 standalone application, or as Type 1 embedded or Type 2 Windows-supported. I explored the first one today, as per the following architectural diagram (kudos again to Satoshi for allowing some snips to be used from his class slides):
So, to start with, I powered on the UP Xtreme i11, ran to the UEFI shell, and used this sequence of commands:
> ShellApp.efi hypervisor

> ShellApp.efi load MiniVisorDxe.efi

> ShellApp.efi hypervisor
You can see the results below:
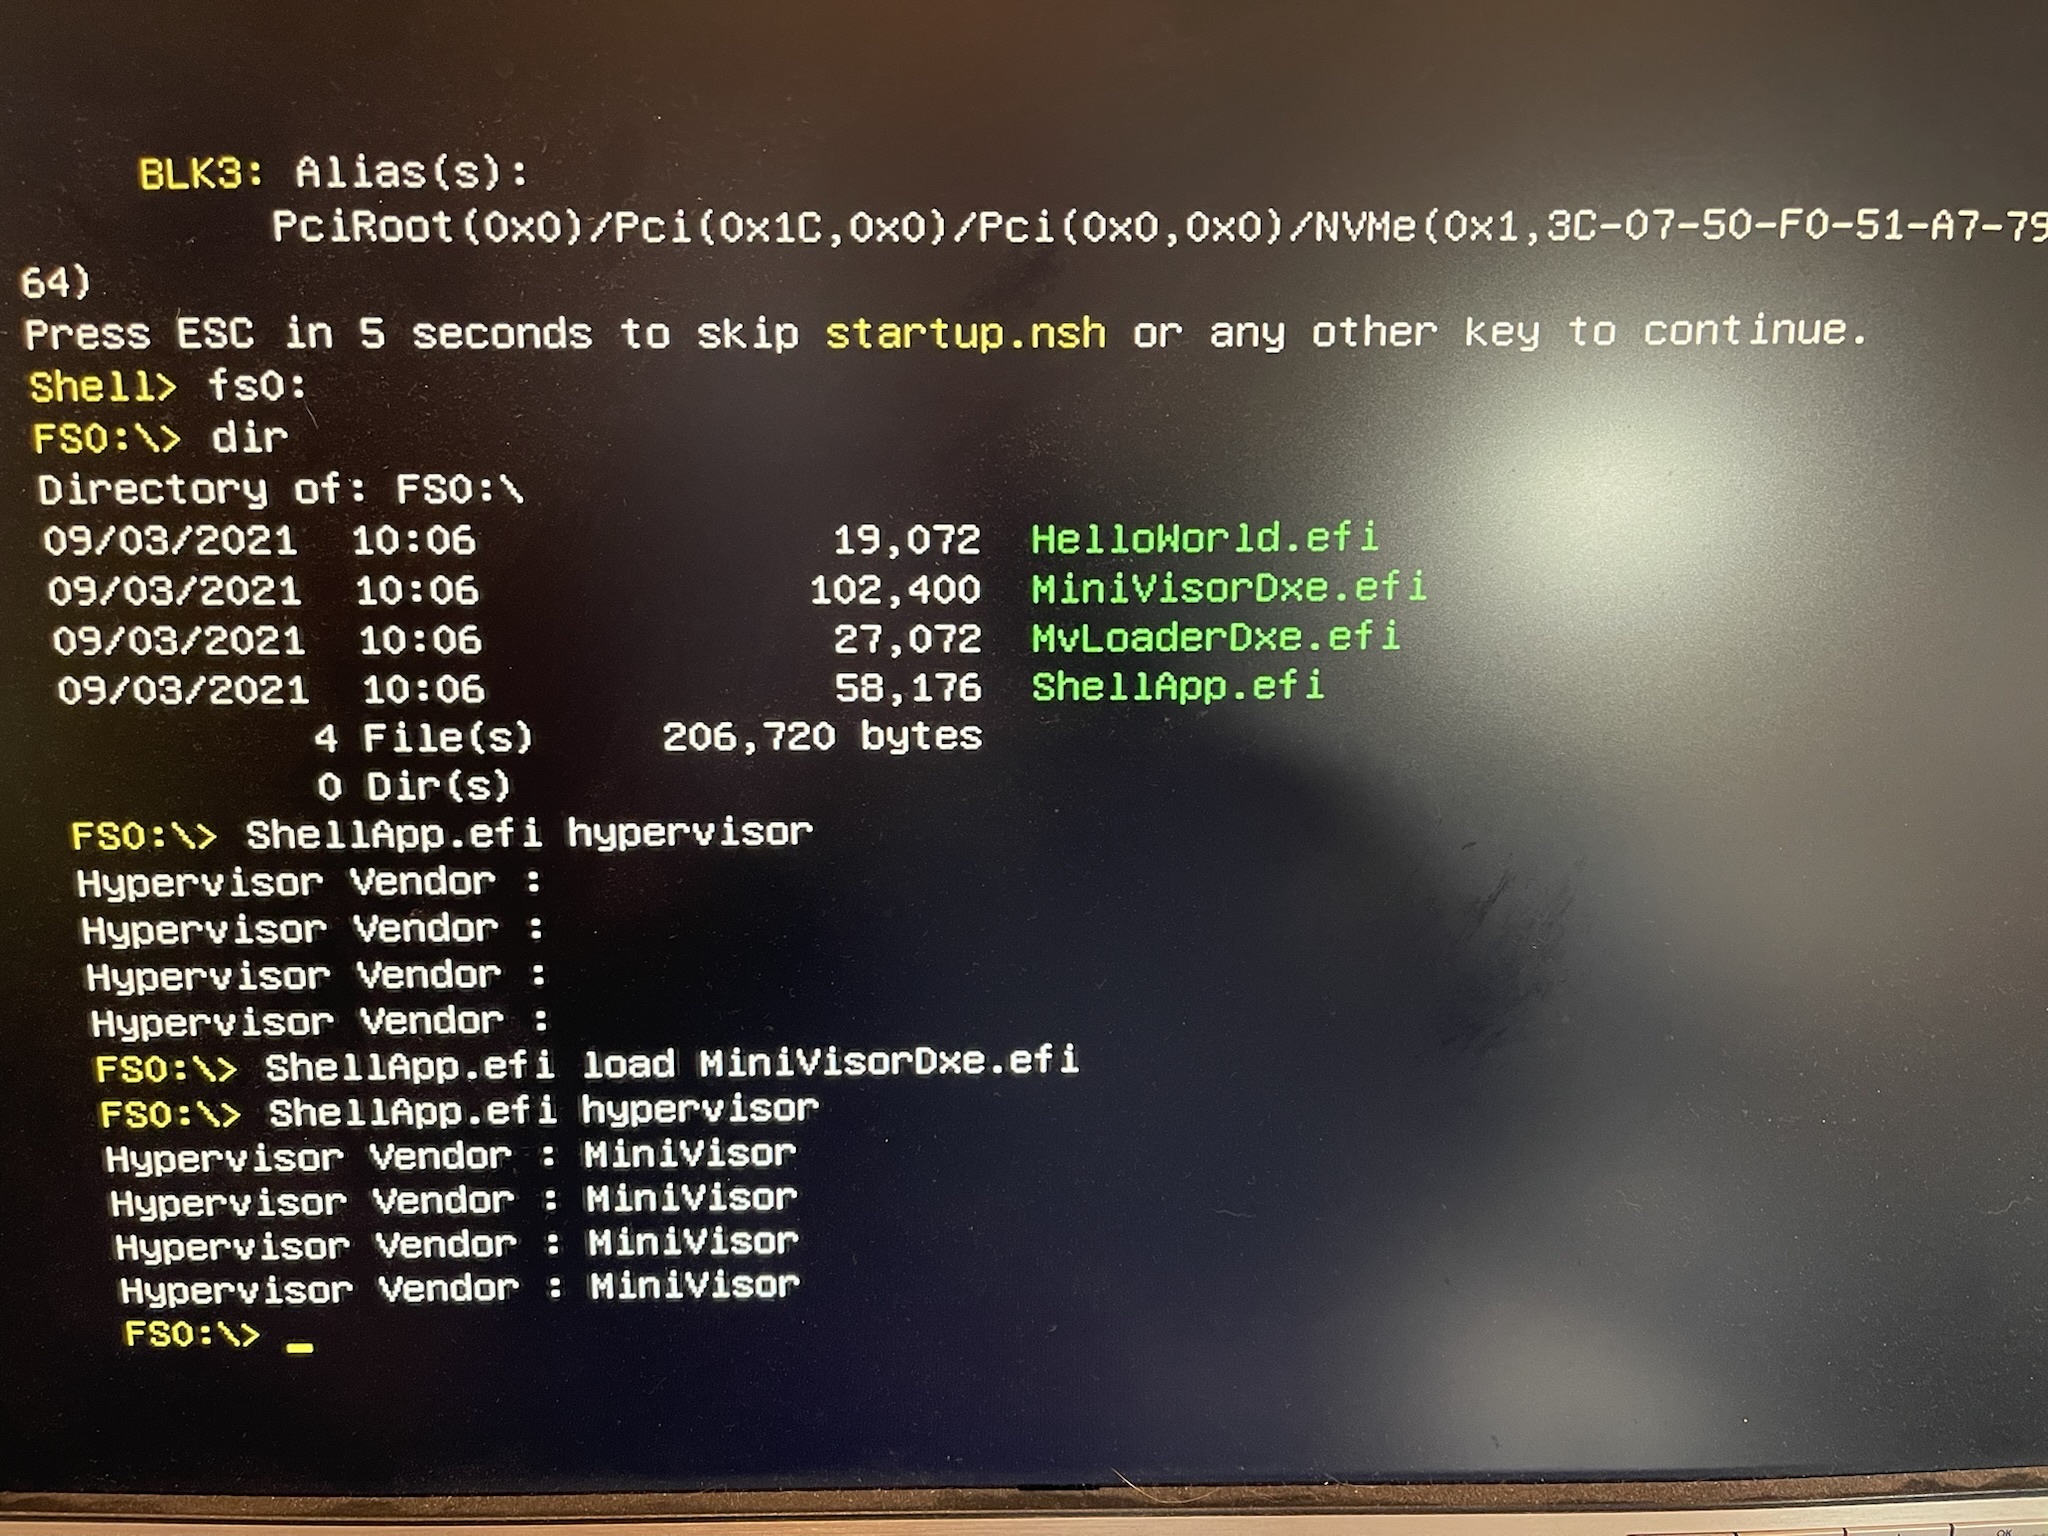
Before loading the hypervisor, “Hypervisor Vendor” is not initialized. Afterwards, it says “MiniVisor”, which is Satoshi’s name for the hypervisor.
Now, that might not be so interesting, except for what’s going on under the hood. We need to look at some of the code to see. When we specify the “hypervisor” parameter to the ShellApp UEFI application, it invokes the following code:
STATIC
VOID
EFIAPI
PrintHyperVisorNameWorker (
IN OUT VOID* Context
)
{
UINT32 registers[4]; // EAX, EBX, ECX, and EDX
CHAR8 vendorId[13];
//
// When our hypervisor or ones that is compatible with the Hypervisor Top
// Level Functional Specification is installed, CPUID leaf 40000000h will
// return hypervisor vendor ID signature in EBX, ECX, and EDX.
//
AsmCpuidEx(CPUID_HV_VENDOR_AND_MAX_FUNCTIONS, 0, NULL, ®isters[1], ®isters[2], ®isters[3]);
CopyMem(vendorId + 0, ®isters[1], sizeof(registers[1]));
CopyMem(vendorId + 4, ®isters[2], sizeof(registers[2]));
CopyMem(vendorId + 8, ®isters[3], sizeof(registers[3]));
vendorId[12] = CHAR_NULL;
AsciiPrint("Hypervisor Vendor : %a\n", vendorId);
}
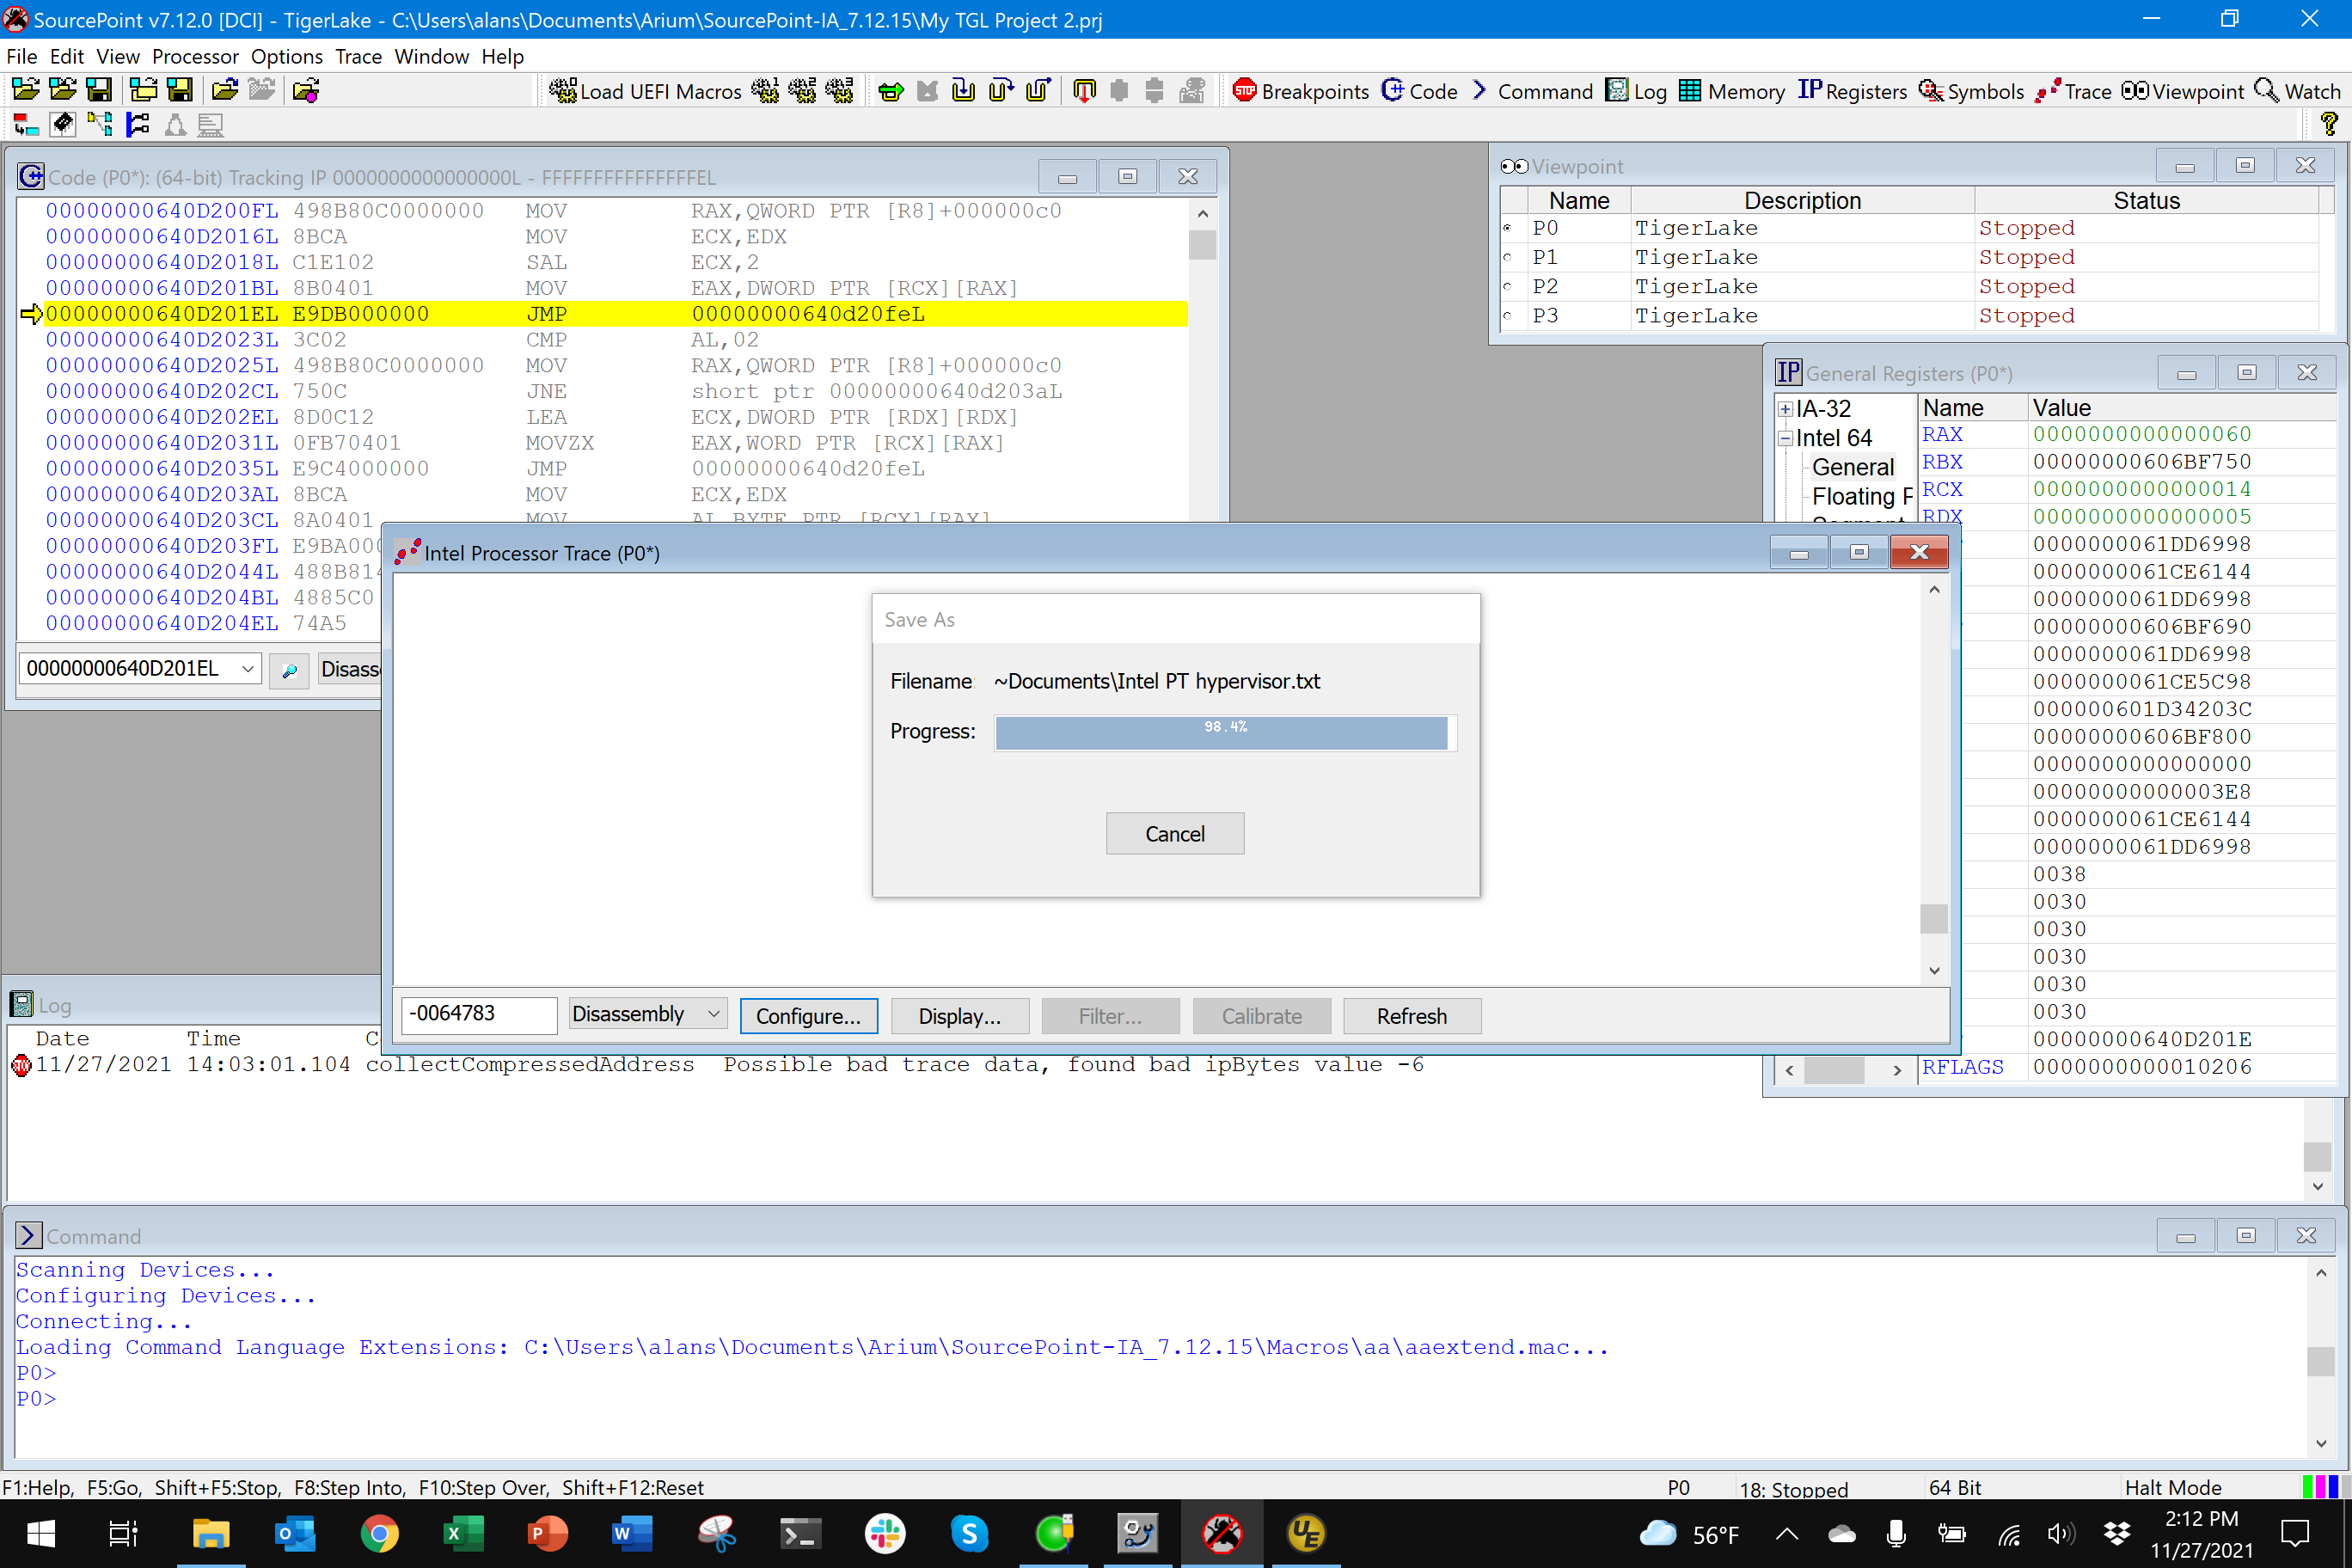
Note the call to AsmCpuidEx. After the hypervisor is loaded, it will trap privileged instructions, such as CPUID, and enter VMX operation. This is what I wanted to see. So, I set up Intel Processor Trace within SourcePoint, set up a 1MB data buffer (this collects about four (4) milliseconds of instruction trace data, which turns out to be 118MB of expanded ASCII-readable trace data, or 1,901,598 assembly language instructions in this case):
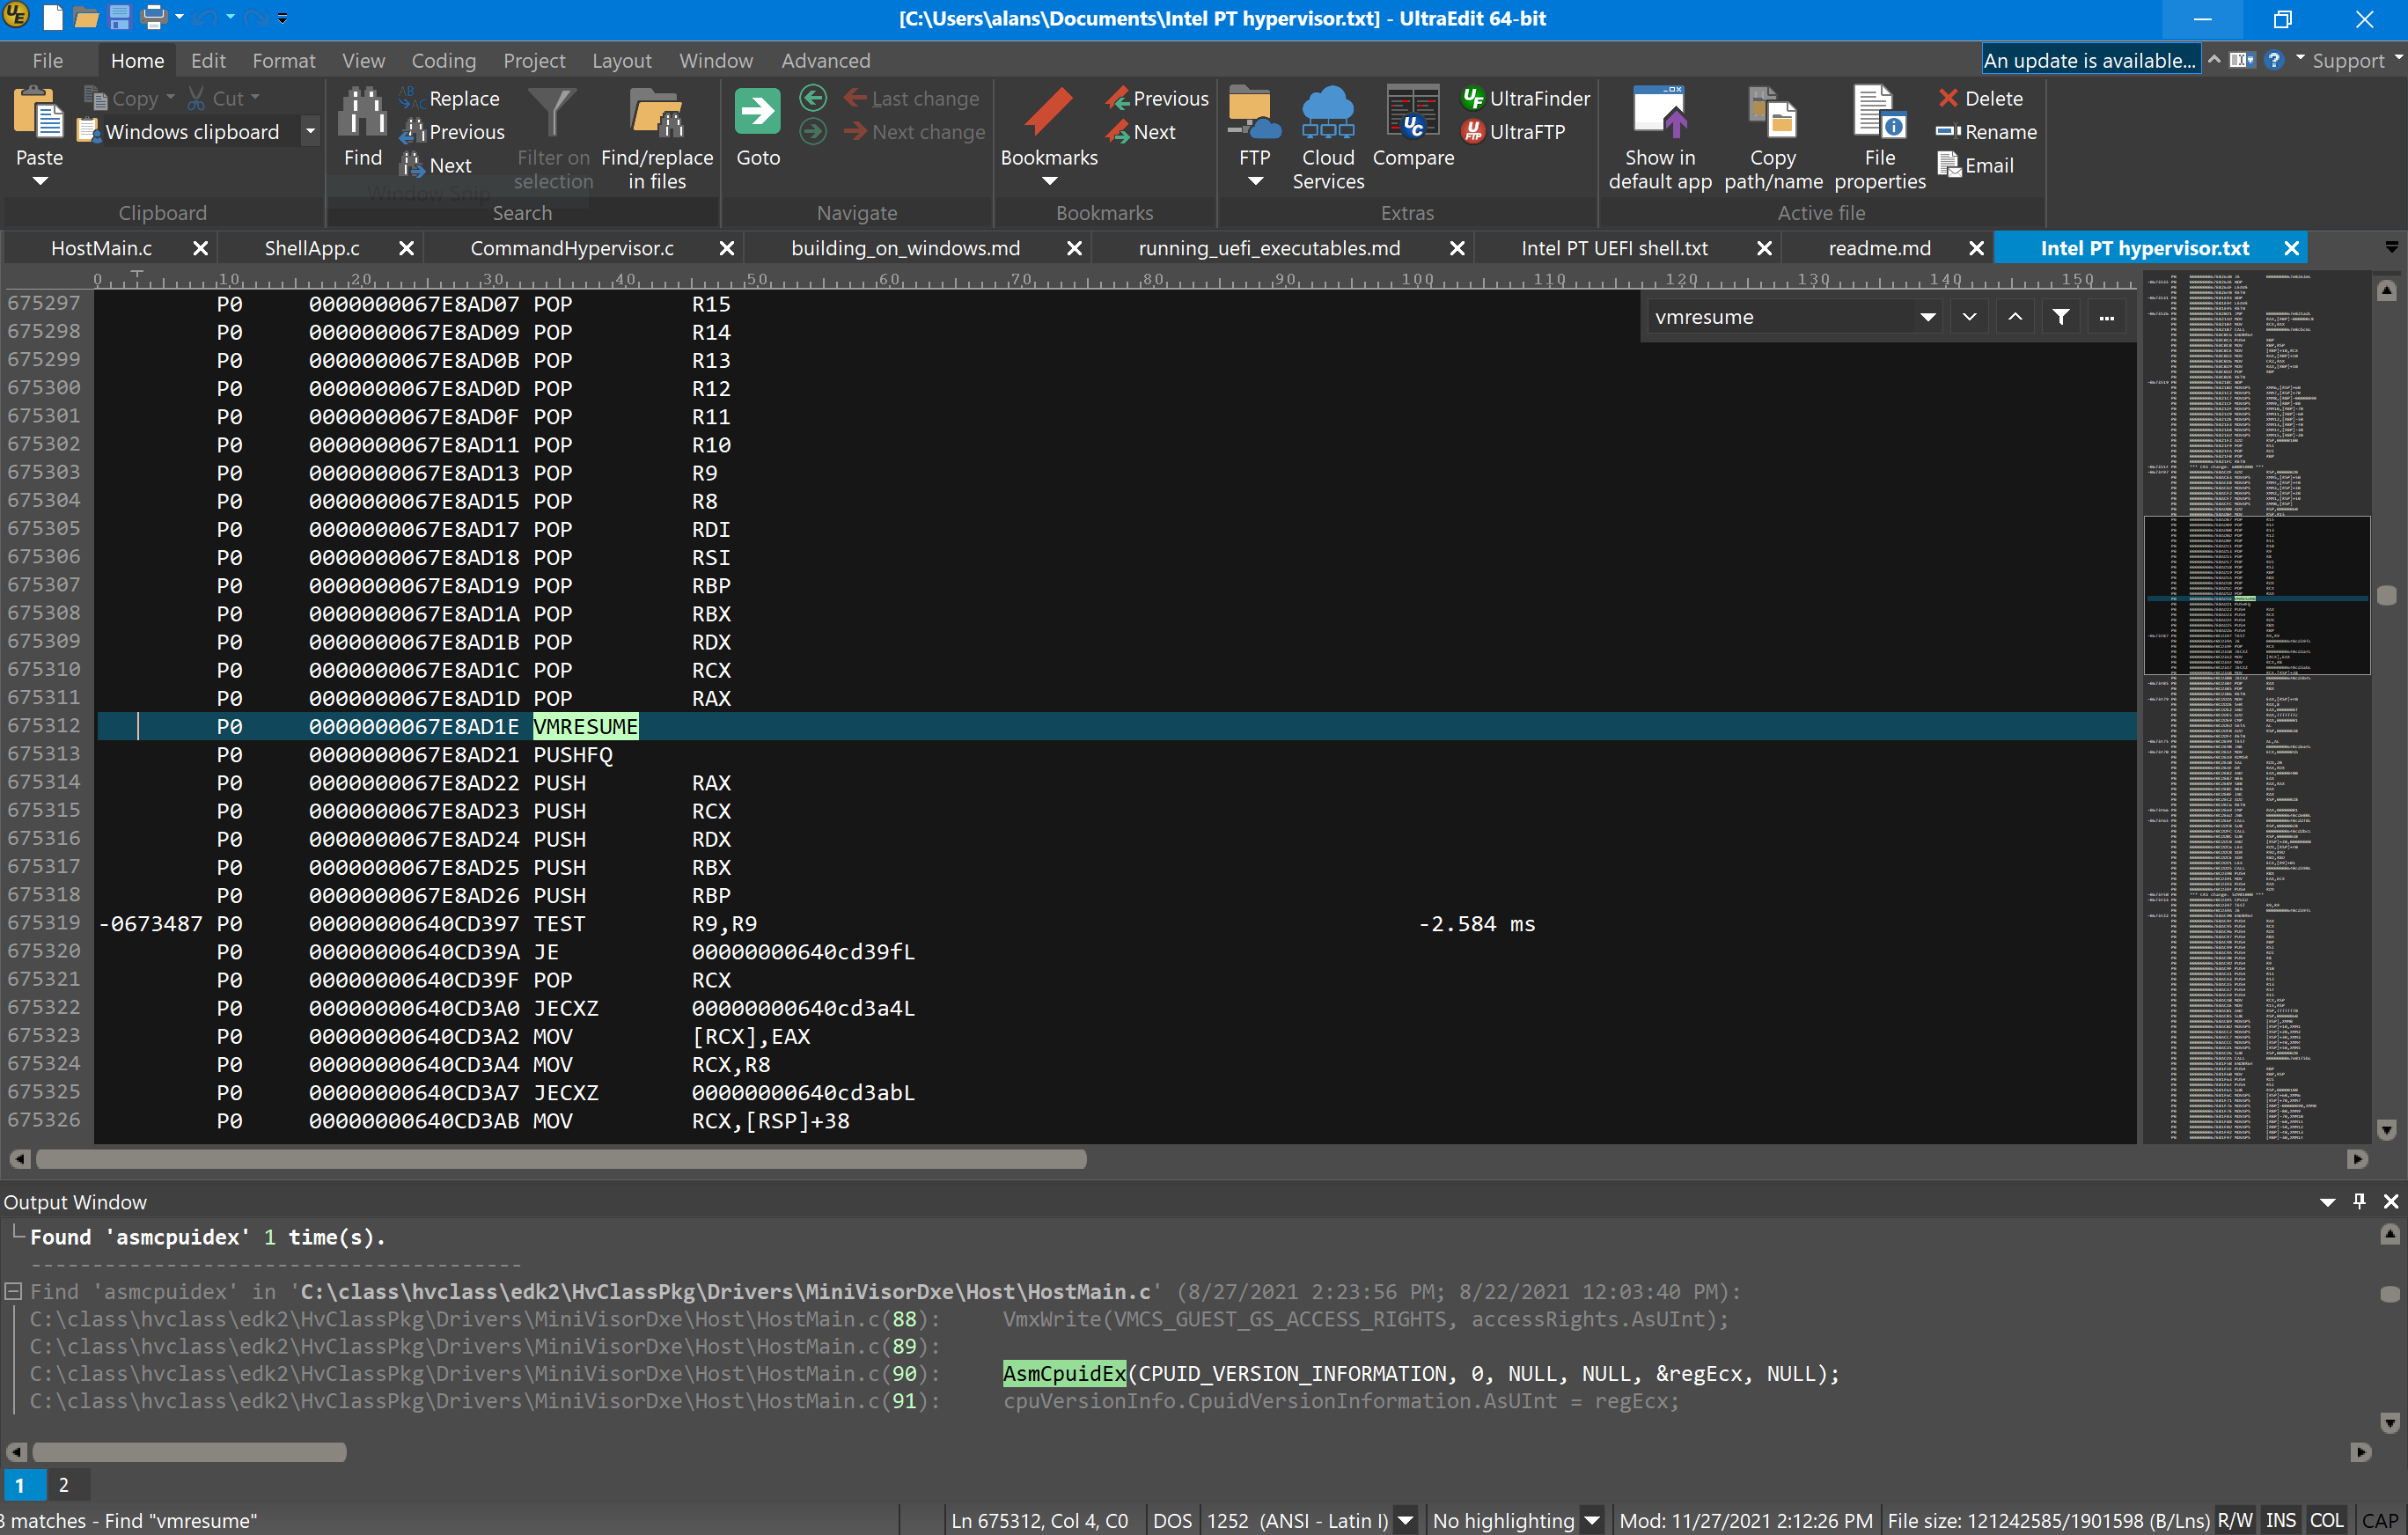
And, within the trace data, you can see the invocations of the VMx-related instructions, for example:
You can use SourcePoint’s internal trace data analysis tools to see a visual view of all four milliseconds of trace data. By moving the cursor around, either by clicking on a point in the code, or using the arrow keys to move back and forth, you can zero in on a particular part of the flow:
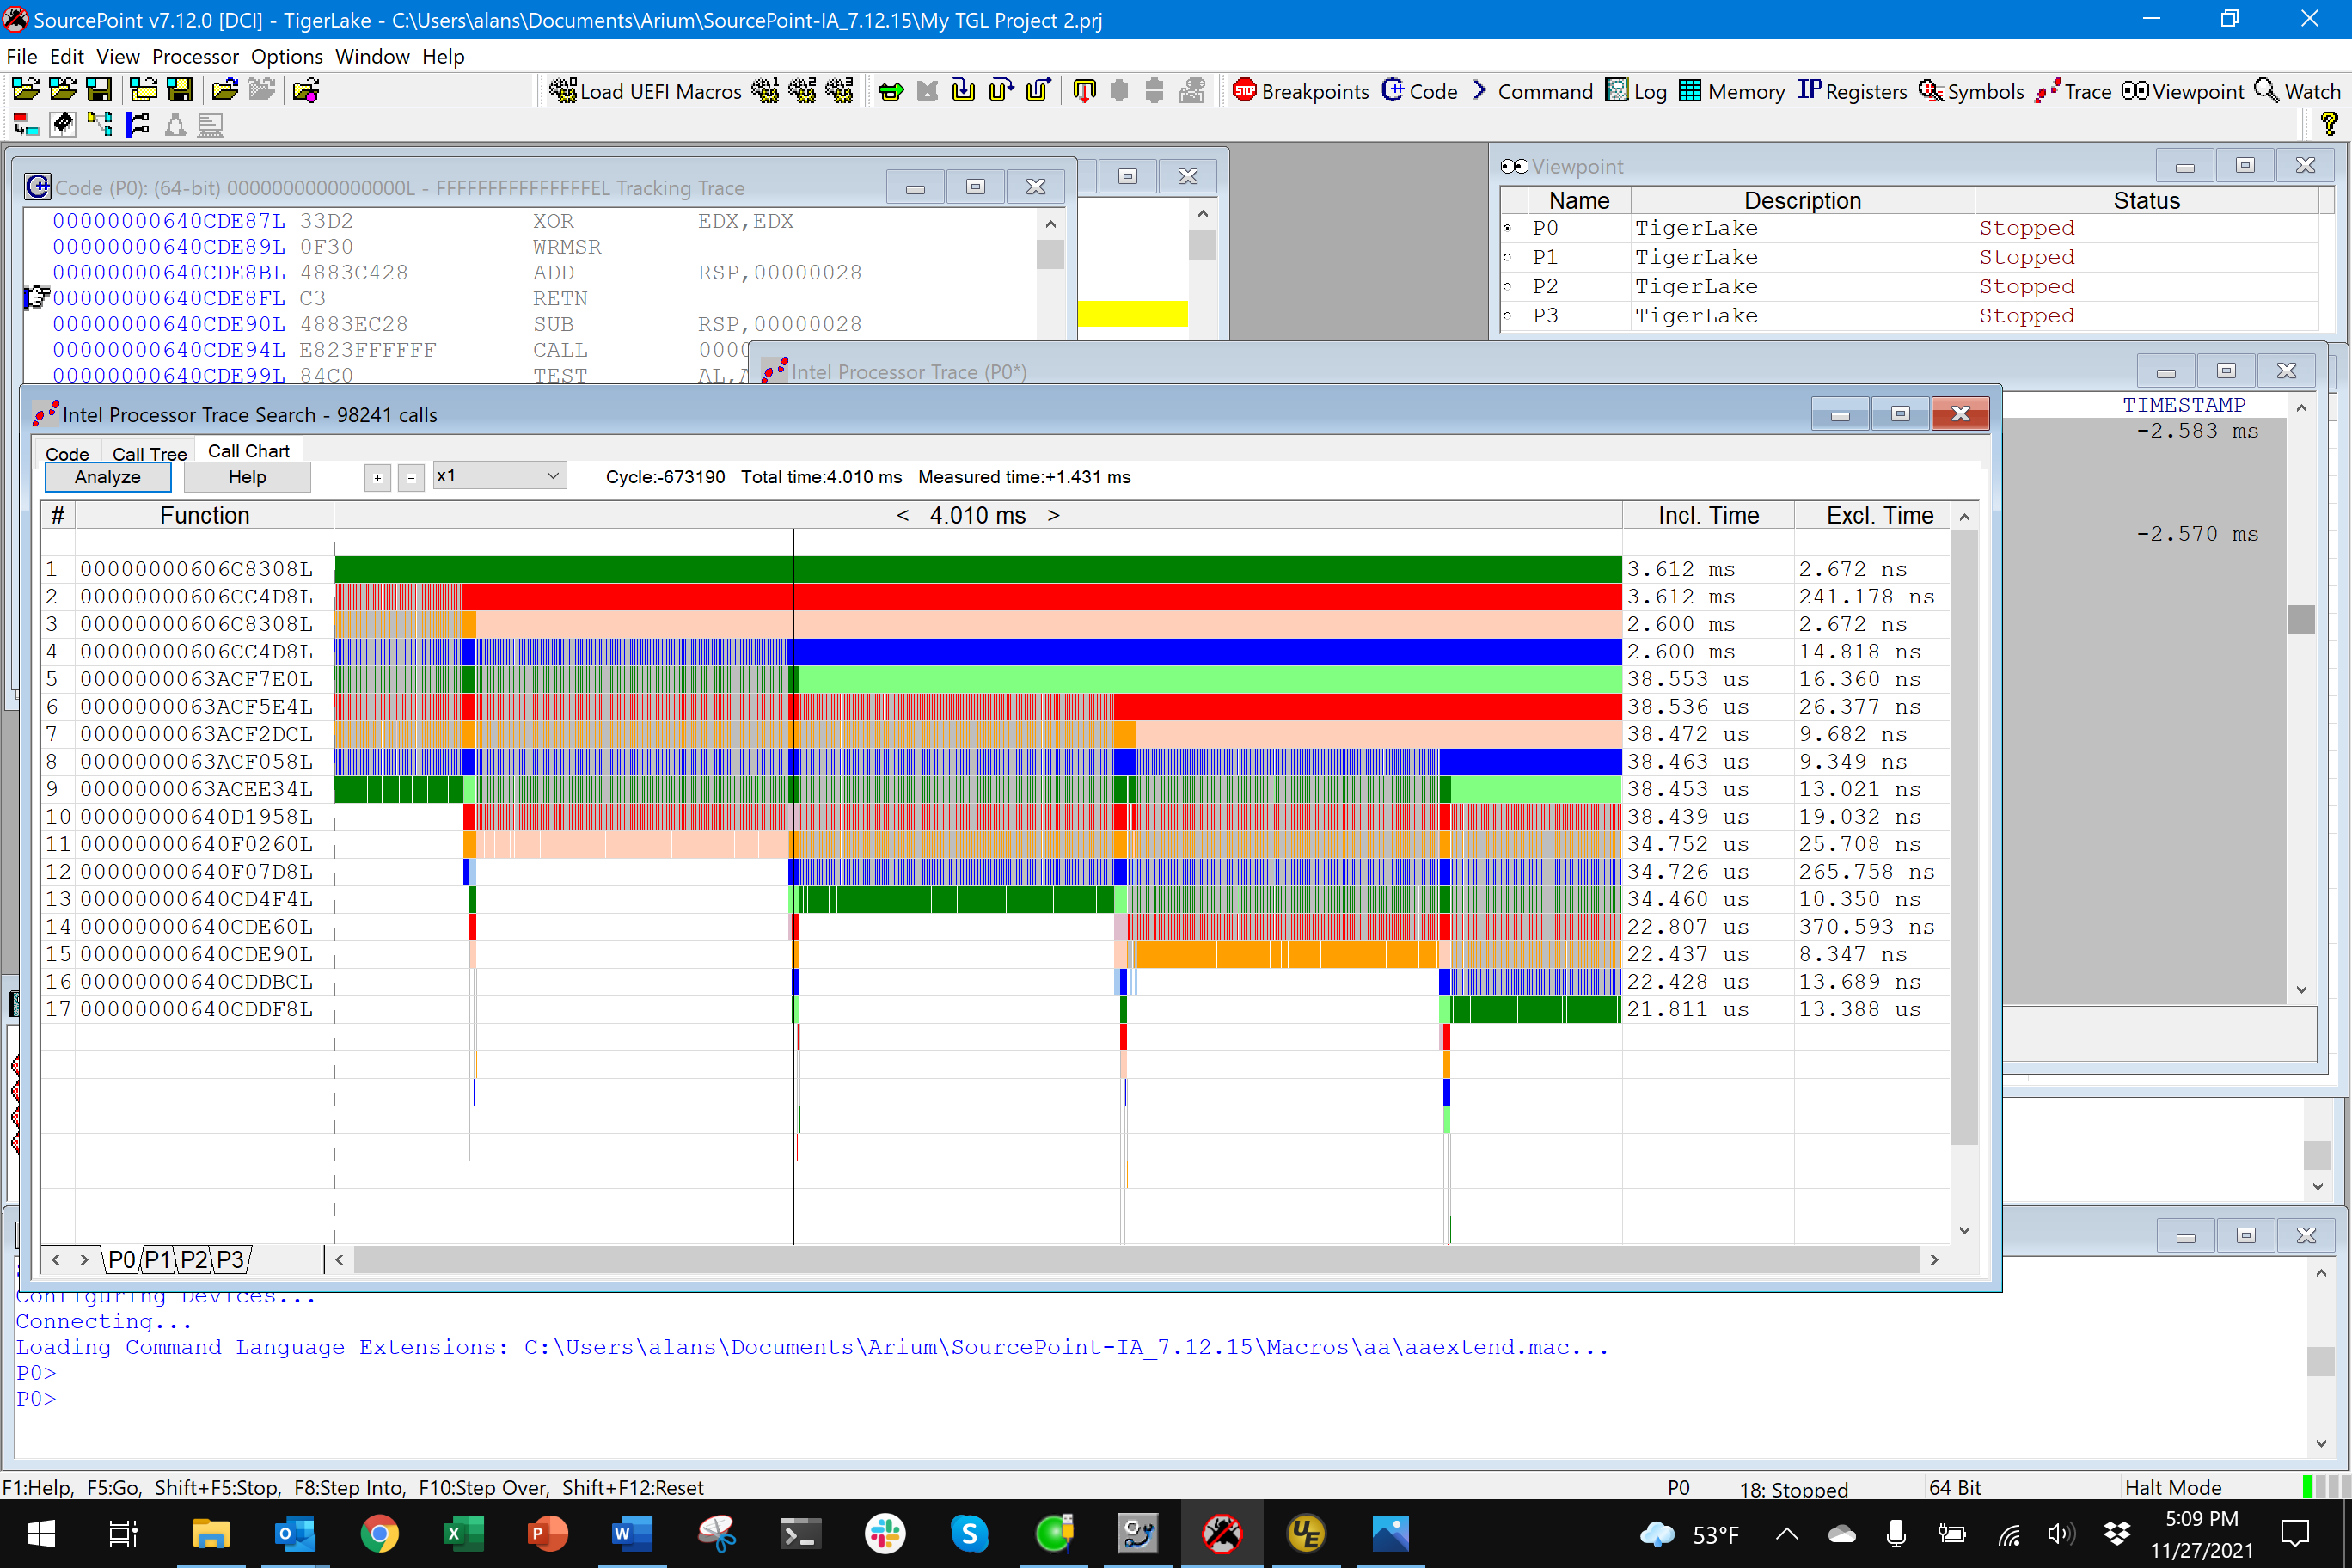
This will look a lot better when I load the source/symbols for this board and the hypervisor. That’s for upcoming episodes. But, in the meantime, you can see how cool it is. And, this is just the beginning. I’ll be unleashing some of the other advanced debug and trace features, such as Architectural Event Trace (AET), on this platform.
To wrap up, I’d also like to say a special thank you to Bruce Dang. He and I connected a long while ago after I read his Practical Reverse Engineering book, and he introduced me to his colleague Satoshi, and the rest is history.