Home / Case Studies / High-End Server Company uses ScanWorks® Embedded Diagnostics for Global, At-Scale Debugging
High-End Server Company uses ScanWorks® Embedded Diagnostics for Global, At-Scale Debugging
In the high-end server industry, systems are expected to operate 24 X 7, with extreme performance and close to zero outage downtime. A leading server OEM looked to ASSET to deliver embedded Intel In-Target Probe (ITP) tools for root-cause identification of the most intermittent, difficult-to-debug hardware, firmware and software faults.
“Our previous strategy with AMD revolved around the use of their Hardware Debug Tool (HDT),” said their Director of Engineering. “When we moved to Intel on our next-generation product line, we went looking for a more robust, feature-rich solution for at-scale debugging, in the lab and in the field. ASSET, as a licensed Intel third-party vendor for run-control, had just what we needed.
“In any given data center, there are thousands of processing nodes, and we needed a means to deliver an embedded version of Intel ITP for system-level access and debug. We use this to debug system crashes and hangs, on any one node in a cluster, by gathering forensic data before the node re-initializes and returns to service.” Such forensic data might include the system’s instruction pointer, particular areas of memory, key register contents, and the state of the devices on the system’s printed circuit board. In this way, low-level failures, such as Catastrophic Errors (CATERRs), can be diagnosed in-situ.
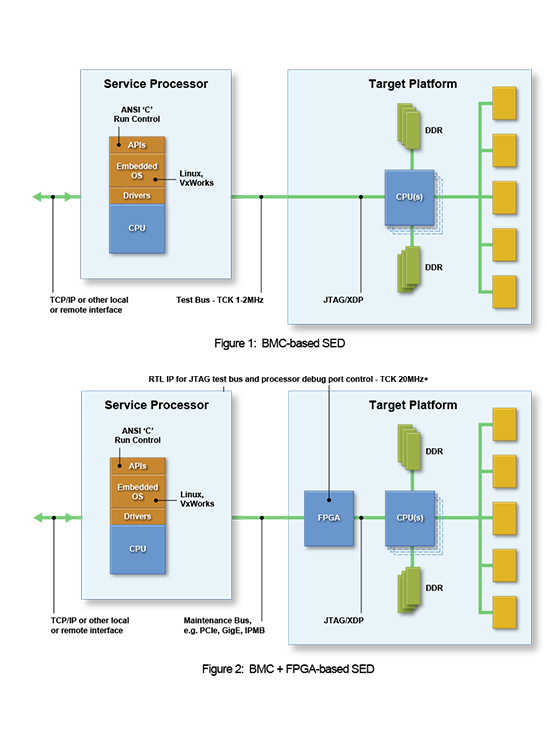
ASSET’s ScanWorks Embedded Diagnostics (SED) solution uses an embedded implementation of ITP to provide these capabilities. Consisting of intellectual property (IP) containing an XDP run-control scan engine, combined with a portable, small-footprint library of ITP functions, SED is embedded within a system board’s service processor and linked to the board’s main processor debug port. The implementation can be within a single Baseboard Management Controller (BMC), as in Figure 1, or in larger systems, a combination of BMC and FPGA, as in Figure 2.
Once SED is instantiated in the system, it is available continually, and provides debugging facilities in every single node, anywhere in the world. As an example, in the case of a watchdog timeout, they can immediately dump the machine check architecture (MCA) registers for later root-cause debugging. More sophisticated troubleshooting invokes library functions such as Read/WriteMSR, Read/WriteIO, and Read/WriteMemory (using the PCI Express Extended Configuration Access Mechanism (ECAM)).
“We recently used SED to debug an intermittent memory issue, which only randomly affected any one node out of thousands,” said the director. The SED embedded ITP, loaded in all of the nodes, kicked into action once the CATERRs occurred, and dumped Home Agent, Integrated Memory Controller and DDRIO device data. Further, post-mortem access to the CPU allowed for further in-situ experiments to be done, to finally isolate the source of the bug.
Since its early adoption, the OEM has found many other applications for SED. Performance changes are prototyped by setting Model-Specific Registers (MSRs) that control turbo boost and processor frequency. Writing I/O memory in the Intel Platform Control Hub (PCH) triggers Non-Maskable Interrupts (NMIs) to gather debug information. An Advanced Configuration Power Interface (ACPI) S5 soft power-down transition on the compute nodes is also accomplished by writing I/O memory. And lane error counters on high-speed serial I/O, such as Intel QuickPath Interconnect, give advanced warning of correctable errors as precursors to performance issues or future outages. SED run-control has been found to be superior to other out-of-band technologies, such as Platform Environment Control Interface (PECI), which have numerous restrictions.
“ASSET’s SED solution gives us the power to debug issues which we’ve only been able to dream about in the past,” said the director. “In our business, system performance is critical, and customers demand absolute accountability for any quality and reliability issues. SED lets us jump on these problems and troubleshoot them quickly. It’s a real competitive differentiator.”
The company’s engineering team will be extending its use of SED as the next-generation platforms come to market. A much higher level of debug automation is promised by an initiative to convert their in-house SED scripts to standards-based Python. This will enable the team to perform numerous other functions, including memory error injection, PCI Express checks, and system and hang dumps; without the need for frequent deviations from the standard code base. Based upon its power and flexibility, SED meets these requirements today and in the future.


