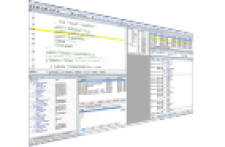
Greater visibility into operating system resources and multithreaded programs accelerates debug and helps software engineers deliver tighter, more robust and higher quality code. With support for the Micriµm® µC/OS-II® real-time operating system (RTOS), ASSET’s SourcePoint® debugger gives development engineers multiple views of the execution context at every point in the code.
“Many embedded designers who are developing software for complex systems-on-a-chip (SoC) like those with ARM cores have chosen Micriµm’s µC/OS-II RTOS because of its rich feature set, including its preemptive, real-time deterministic multitasking,” said Larry Osborn, ASSET product manager for SourcePoint. “In safety-critical applications, for example, deterministic code flow is imperative to ensure the reliability of the software. The challenge developers face is how to get the timing of the code correct. Now, with SourcePoint’s clear visibility into kernel resources, insight into the content of task stacks and views of context switching, developers have the visibility they need to overcome these challenges.”
SourcePoint lets software engineers select one of the operating system’s resources and context-sensitive debug information is automatically displayed. The selectable resources include threads, timers, queues, semaphores, mutexes (mutual exclusions) and other components of the operating system.
“The quality and reliability of code are very important to developers. With the SourcePoint debugger on their side, programmers will have a clear view into their µC/OS-II code so they can ensure its robustness,” said Jean Labrasse , chief executive officer of Micriµm. “We are very excited about working with ASSET and having the SourcePoint debugger as a tool for developers in the µC/OS-II community.”
While debugging code for a preemptive kernel like the kernel in µC/OS-II, software developers often must determine the cause of a preemption. SourcePoint has a number of capabilities which speed up this process, including a view of the currently running thread at the point where the preemption occurred as well as visibility into the task states of all threads and stack frames. With this insight, the developer will understand the nature of a preemption. Depending on what was discovered through SourcePoint’s enhanced visibility, the designer might decide to insert a semaphore in the code, for example.
Hardware Modules: To serve the needs of different types of design teams working on a wide range of applications, two ASSET hardware modules support the SourcePoint™ debugger. The cost-effective Arium LC-500Se is a run-control probe capable of providing application software debug via JTAG. Another hardware module, the Arium LX-1000 Trace Port Analyzer, has two gigabytes of memory where trace results can be stored off-chip.


