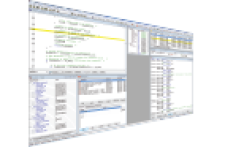
When software engineers have greater visibility into the context of operating system resources and the execution of multithreaded programs, they are able to accelerate code debug and deliver new products to market sooner. ASSET's SourcePoint® debugger now supports Express Logic’s ThreadX real-time operating system, giving development engineers multiple views of the code execution context at any point in a program.
With SourcePoint, the software engineer can select one of ThreadX’s resources and the debug information automatically displayed will be context-sensitive. The selectable resources include threads, timers, queues, semaphores, mutexes (mutual exclusions) and other components of the operating system. SourcePoint became a part of ASSET’s portfolio of debug, validation and test tools when Arium™ was acquired by ASSET last year.
“Many complex systems-on-a-chip (SoC) for today’s embedded designs require an operating system like ThreadX that has a small-footprint, but is also very responsive,” said John Carbone, vice president of marketing at Express Logic. “Software developers encounter problems when they get to the debug stage because they have to find the root causes of bugs in complex programs made up of multiple threads running concurrently on multiple cores. It’s not easy, but giving these developers the context-sensitive visibility that comes with a tool like ASSET’s SourcePoint debugger helps tremendously. We believe that ASSET’s SourcePoint debugger will help ThreadX developers complete their projects sooner.”
The SourcePoint debugger can display a view of the currently running thread at the point where it was stopped or another thread that is preparing to run. The program counter for the thread is displayed where the software was interrupted. The stack frame as well as the variables for the thread will also be displayed. Selecting one of SourcePoint’s resource tabs will show the engineer the state of each thread in the program as well as the condition the thread needs to continue execution.
“Supporting the ThreadX operating system and other real-time operating systems is particularly critical in the embedded marketplace where the interaction of hardware and software on systems-on-a-chip is becoming much more complex and pervasive,” said Larry Osborn, ASSET product manager for software debug and trace tools based on technology from Arium. “We’re seeing more often these days that debugging software in isolation from the hardware or vise versa is not always effective because of the mutual dependencies. SourcePoint will certainly accelerate code debug dramatically and then many of the other tools on ASSET’s ScanWorks® platform can help with the rest of system validation.”
Hardware Modules: To serve the needs of different types of design teams working on a wide range of applications, two ASSET hardware modules support the SourcePoint debugger. The cost-effective LC-500Se is a run-control probe capable of providing application software debug via JTAG. Another hardware module, the LX-1000 Trace Port Analyzer, has two gigabytes of memory where trace results can be stored off-chip.
Embedded developers might also be interested in a recent eBook we’ve published on how to capitalize on the capabilities of ARM’s System Trace Macrocell (STM). Check it out here.


