SourcePoint CScripts
Home / Products / SourcePoint / SourcePoint CScripts
About SourcePoint CScripts
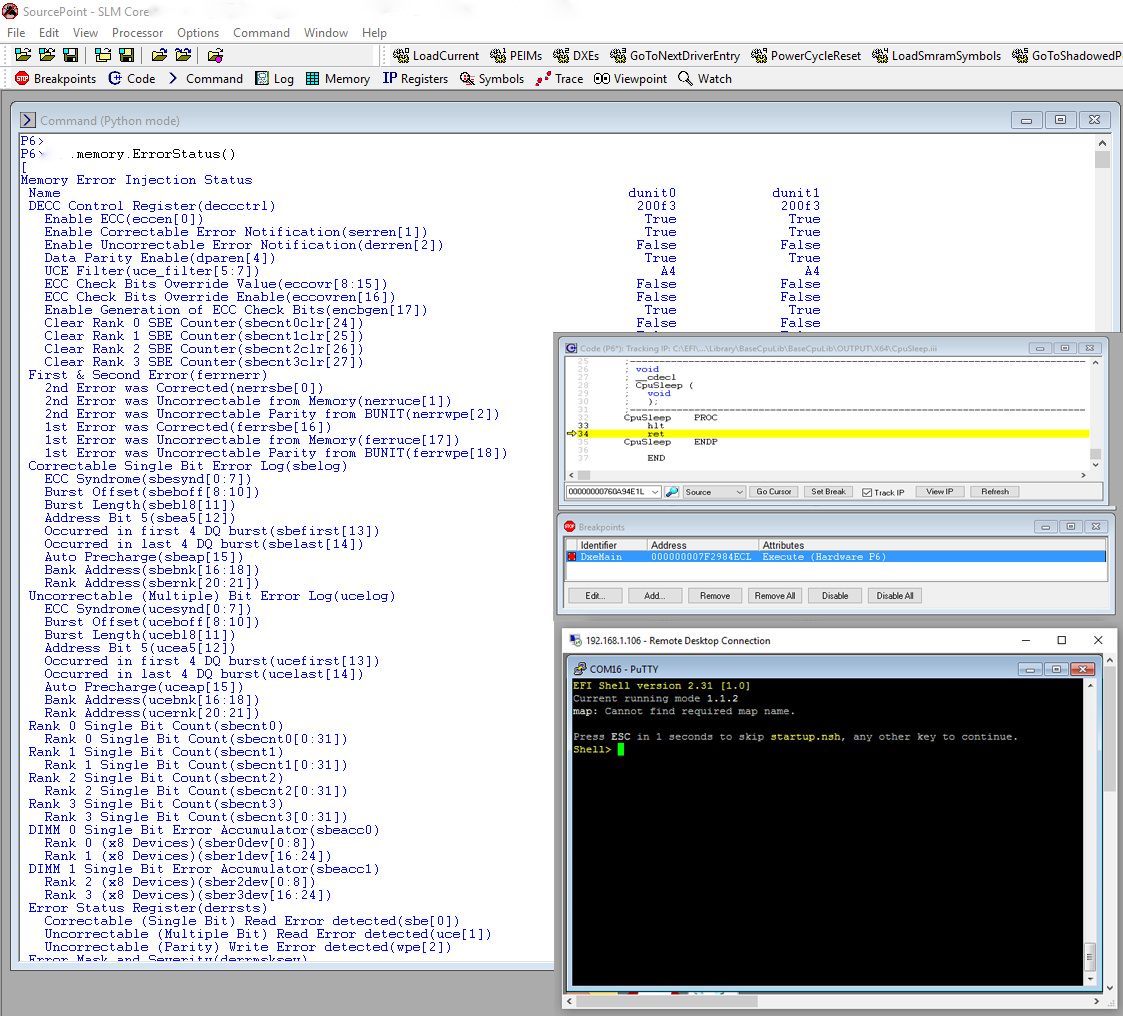
Platform bring-up is always challenging. SourcePoint supports Intel CScripts (Customer Scripts) to enable platform debug, error analysis, and error injection via a Python Command Line Interface (CLI) which is integrated with SourcePoint’s premier UEFI debug capability. Use one tool to do UEFI source-level debug and platform validation using the CScripts.

SourcePoint for Intel - CScripts
CScripts are provided to Original Equipment Manufacturers (OEMs), Original Design Manufacturers (ODMs) and others to ease the task of bringing products based upon Intel processors to market. CScripts are implemented as Python scripts and are used at board bring up as well as at various times during debug or when an error occurs.
CScripts are platform specific and use hardware features enabled within the silicon to accomplish the task of debugging, hardware validation and error injection.
Supporting the CScripts is a Python language-based Command-Line Interpreter (CLI) environment. SourcePoint implements the underlying worker functions directly, instead of using the Intel DAL. SourcePoint provides its own Python CLI environment, which mirrors much of the functionality of the Intel Python CLI.
ScanWorks Embedded Diagnostics - CScripts
ScanWorks Embedded Diagnostics (SED) is a custom embedded ITP implementation that provides on target run-control via the Baseboard Management Controller (BMC) for target applications that require 5 nines or 6 nines reliability. In these applications, a failure must be analyzed without the actual plugging in of an ITP JTAG probe. This requirement implies that the software is already resident on the target and that an external processor (BMC) has the ability to conduct forensics on the hung server processor. Intel has implemented the ability for a crashed/hung processor to keep valuable postmortem information available within the CPU.
The purpose of SED is to allow the customer to run CScripts from a remote host connected to the failing server to extract this data prior to system reset.
As each server design and requirements are unique, SED is customized to meet the target constraints to accomplish the goal of data extraction.
Related Products

Intel® JTAG debugger products are designed to make the developer’s job easier. We have worked with Intel for over fifteen years, providing tools that are feature-rich in both hardware and software, making it easy for the user to accelerate development time. An example is UEFI development, where we provide macro files that allow for context-sensitive debugging in the PEIM, DXE and other boot phases.
Our tight integration of hardware and software for Intel JTAG-based debug lends itself to a robust development environment, helping to minimize the challenges associated with debugging code.


