I became curious this past week on how UEFI handles POST codes. These are “markers” for the boot process, and tells you at what stage the platform initialization is. Can we easily correlate POST codes with the operation of the UEFI firmware?
What is a POST code? During an x86 board power-on, the BIOS sends progress codes (POST codes) to I/O port x’80’. If anywhere during the boot process, the board fails, it will be frozen at the last POST code, which gives a hint as to where the problem is. Often, the POST code is displayed on an LED display on motherboards (typically server class). Alternatively, and for the purposes of this article, the POST code is output from the serial port while a debug image that I built for the UP Squared board boots. So, from the PuTTY console, below are some examples as to how the POST codes manifest themselves:
……
Re-install Si CPU Policy Ppi in Post-Memory

CPU PEI Policy Initialization Done in Post-Memory

PeiPolicyInit – End

POSTCODE=<0019>
……
PlatformBootManagerBeforeConsole

POSTCODE=<92>
……
PCI Bus First Scanning

POSTCODE=<94>
……
XhCDriverBindingStart: XHCI started for controller @ 76E39818

POSTCODE=<9A>
The actual “write” to port x’80’ is done via the x86 OUT instruction, which copies the value from the second operand (often programmatically the AX register) to the I/O port specified in the first operand (often the DX register):
OUT DX, AX
So, for POST codes, DX is set to x’80’, and AX contains the specific progress or POST code that is to be output.
With SourcePoint, it’s easy to stop the Intel CPU at each write to port 80, by setting a breakpoint at the OUT instruction that manifests it. Using our powerful macro language, you set a breakpoint at port 80 writes, run until you hit it, and then display the contents of the AX register (the POST code) all by concatenating three commands on one line of the Command CLI window:
go til 80io; wait; ax
And, if you’re really clever, you set up Intel Processor Trace to trigger on these breakpoints, and capture a ton of instruction execution trace leading up to the OUT instruction. Then walk backwards through the code flow to see what is happening.
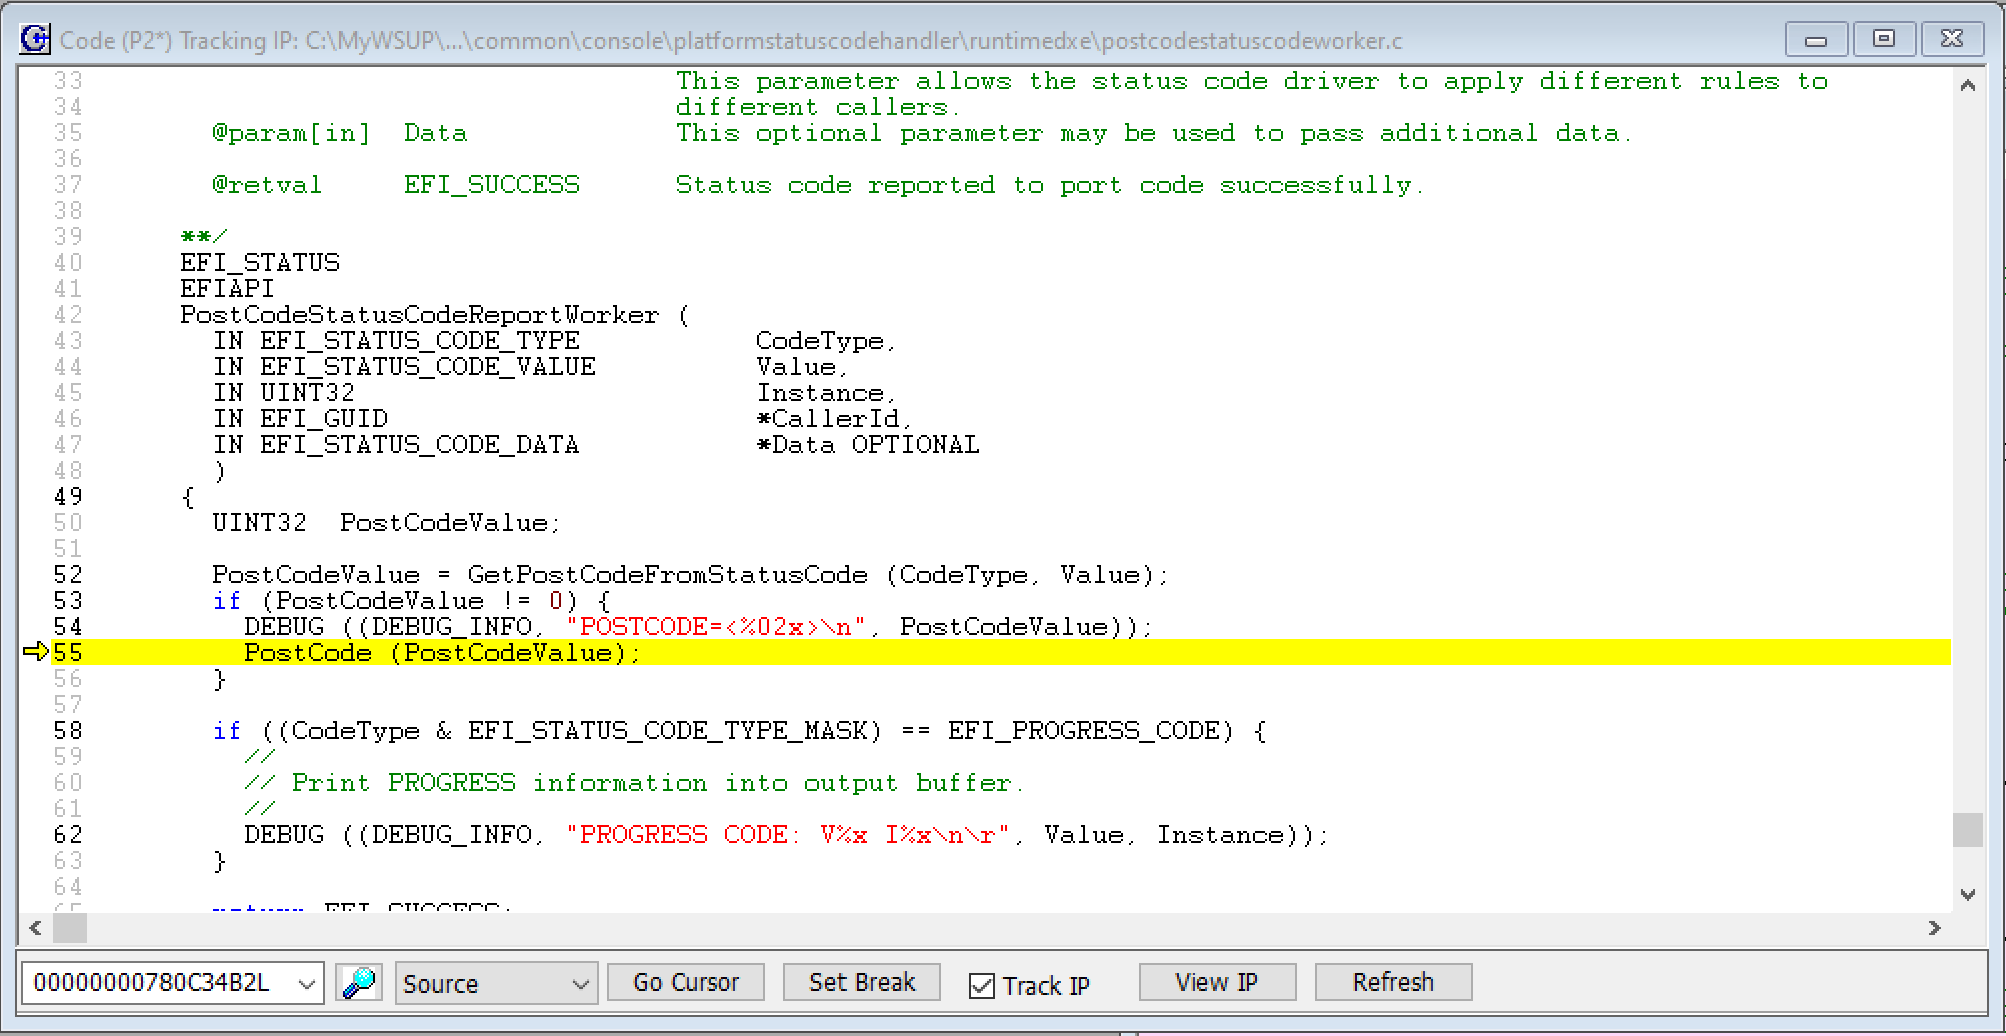
I booted up the UP Squared, halted at a random spot in the code, and then used the above Go command string to halt at the next POST code. The SourcePoint Code window is displayed below, with the code display pick list at the bottom set to “Source”. Note we are in postcodestatuscodeworker.c, within the function PostCodeStatusCodeReportWorker, halted at the PostCode() function:
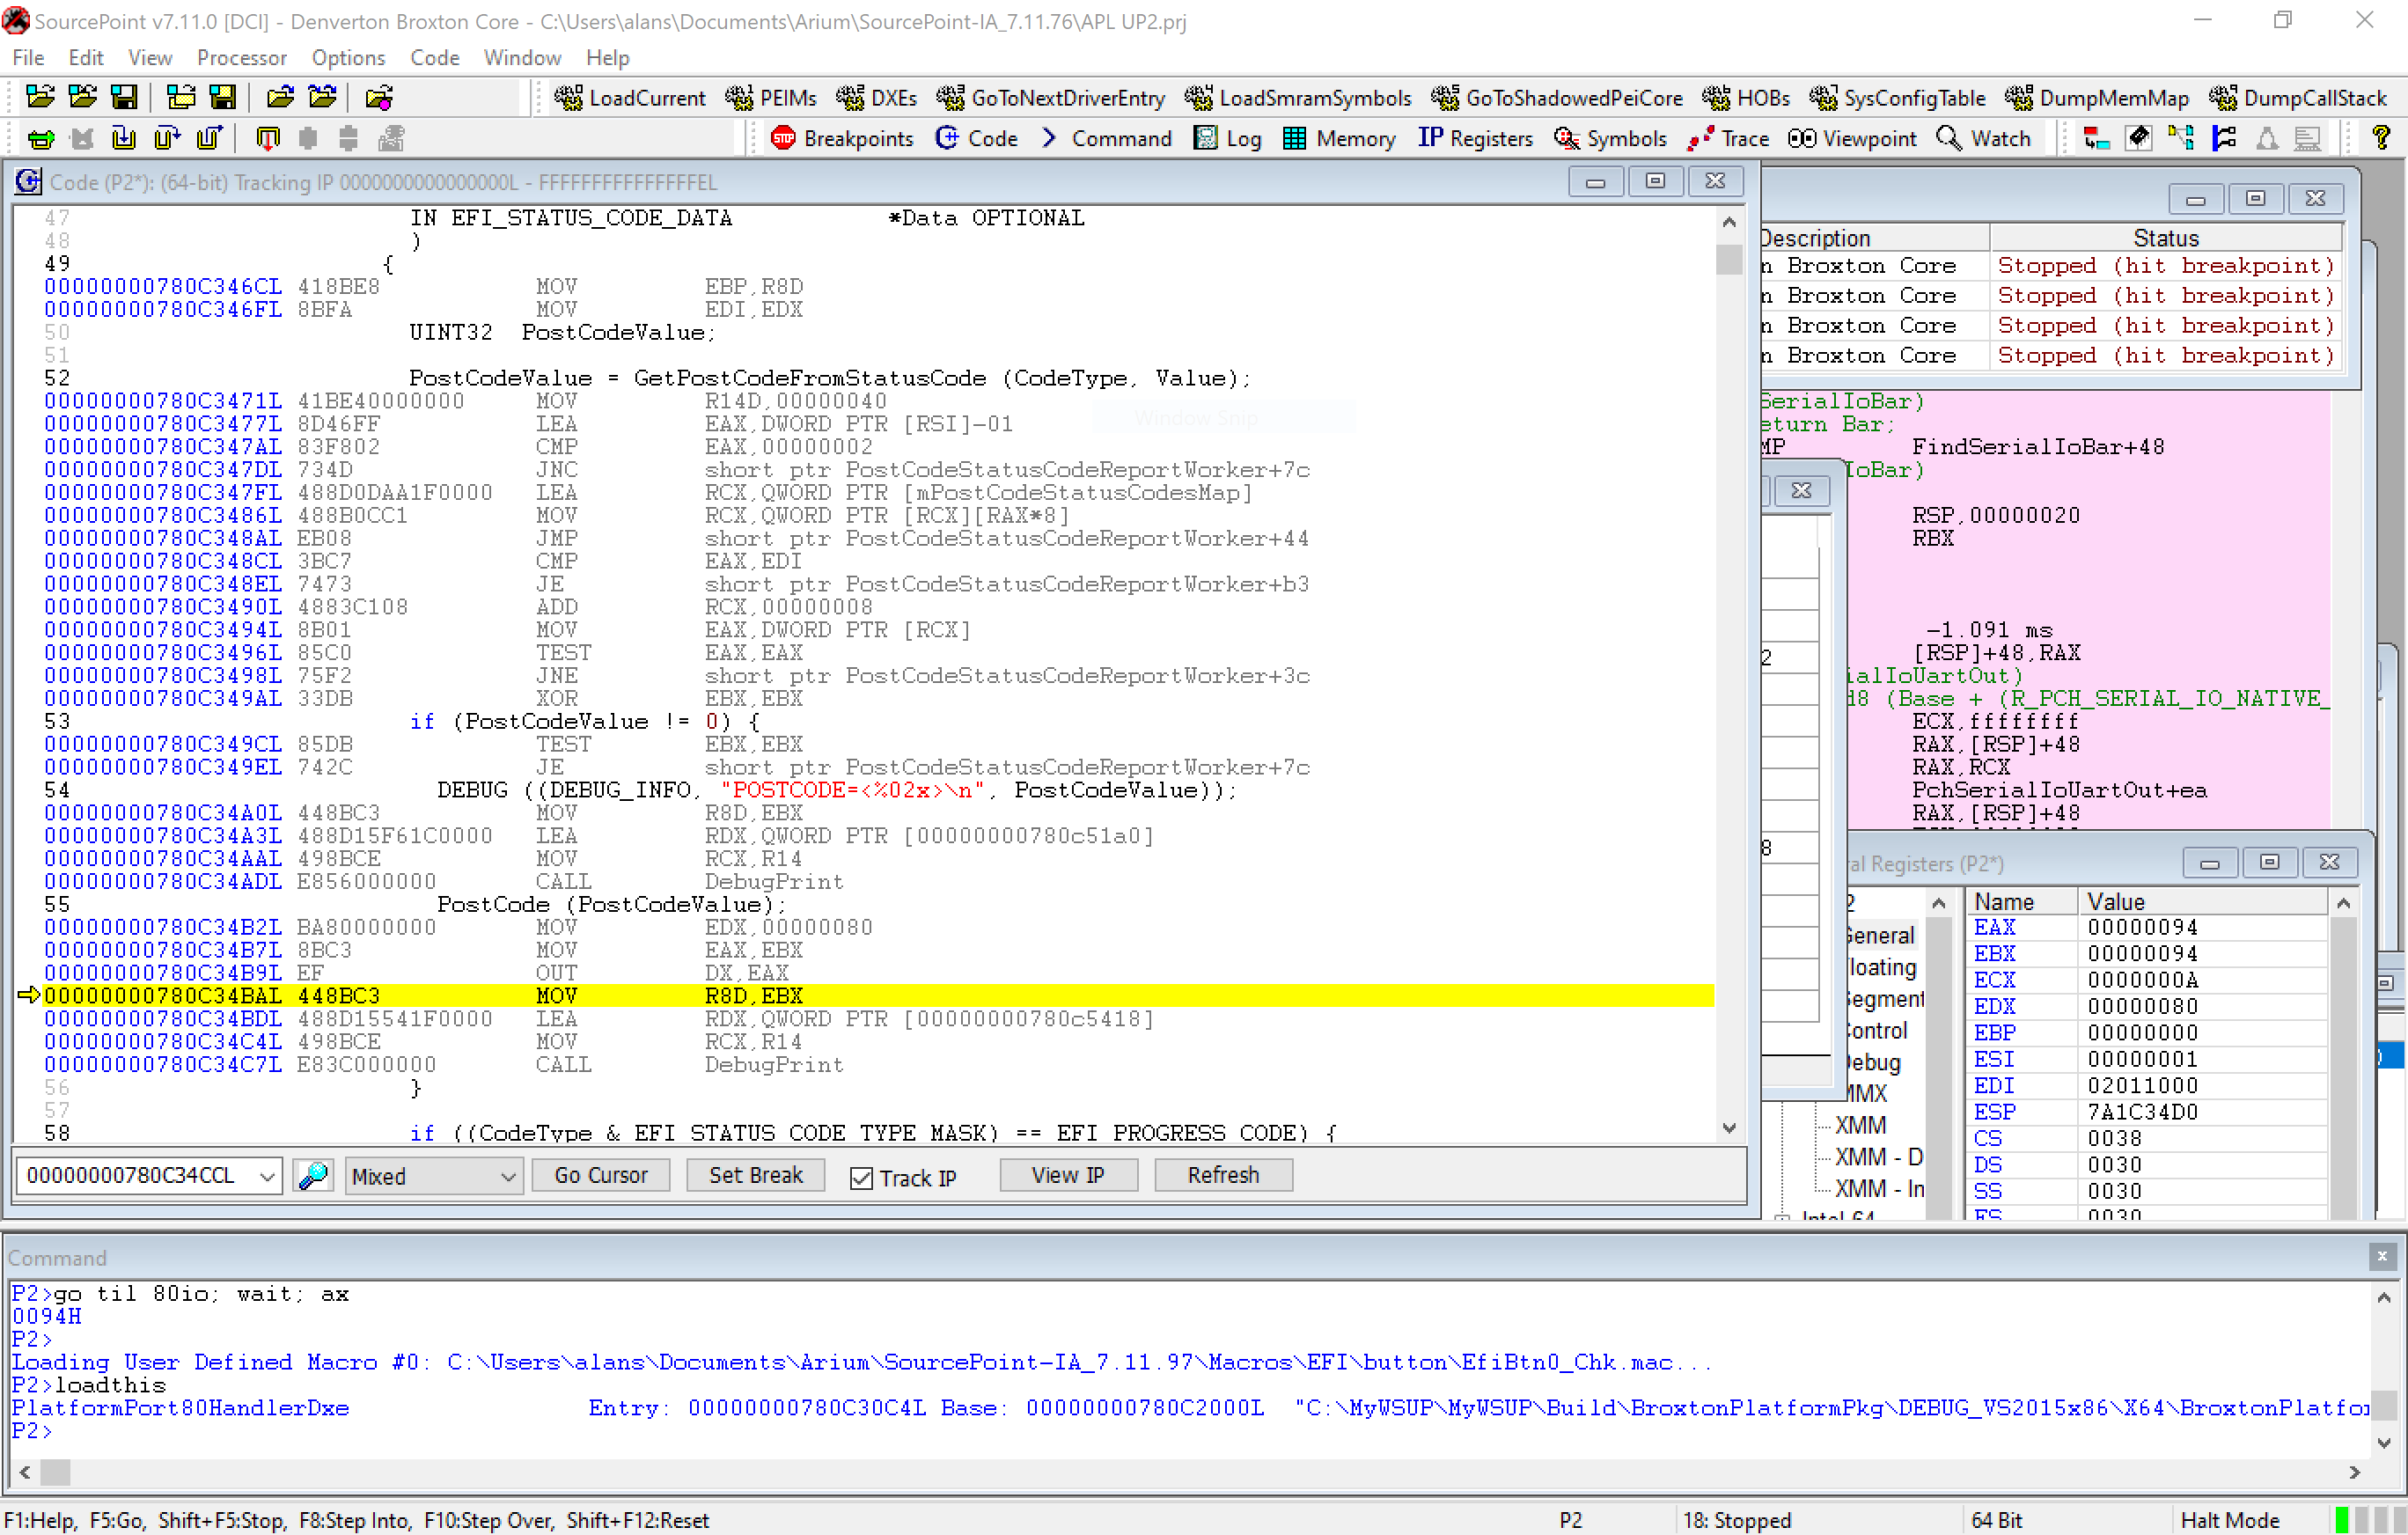
Switching the Code window view to Mixed mode shows that we halted exactly immediately after the OUT instruction, and in the General Registers window on the right, the AX register is set to x’94’ (you can see this as well in the Command window docked at the bottom):
It’s easier if we look at the code within postcodestatuscodeworker.c in its entirety:
/** @file
  PostCode status code implementation.

  Copyright (c) 2010 - 2016, Intel Corporation. All rights reserved.<BR>

  This program and the accompanying materials
  are licensed and made available under the terms and conditions of the BSD License
  which accompanies this distribution.  The full text of the license may be found at
  http://opensource.org/licenses/bsd-license.php.

  THE PROGRAM IS DISTRIBUTED UNDER THE BSD LICENSE ON AN "AS IS" BASIS,
  WITHOUT WARRANTIES OR REPRESENTATIONS OF ANY KIND, EITHER EXPRESS OR IMPLIED.

**/

#include "PlatformPort80HandlerRuntimeDxe.h"

/**
  Convert status code value and write data to port code.

  @param[in]  CodeType         Indicates the type of status code being reported.
  @param[in]  Value            Describes the current status of a hardware or
                               software entity. This includes information about the class
                               and subclass that is used to classify the entity as well as an
                               operation.
                               For progress codes, the operation is the current activity.
                               For error codes, it is the exception. For debug codes, it is
                               not defined at this time.
  @param[in]  Instance         The enumeration of a hardware or software entity within
                               the system. A system may contain multiple entities that match
                               a class/subclass pairing. The instance differentiates between
                               them. An instance of 0 indicates that instance information is
                               unavailable, not meaningful, or not relevant.
                               Valid instance numbers start with 1.
  @param[in]  CallerId         This optional parameter may be used to identify the caller.
                               This parameter allows the status code driver to apply
                               different rules to different callers.
  @param[in]  Data             This optional parameter may be used to pass additional data.

  @retval     EFI_SUCCESS      Status code reported to port code successfully.

**/
EFI_STATUS
EFIAPI
PostCodeStatusCodeReportWorker (
  IN EFI_STATUS_CODE_TYPE           CodeType,
  IN EFI_STATUS_CODE_VALUE          Value,
  IN UINT32                         Instance,
  IN EFI_GUID                       *CallerId,
  IN EFI_STATUS_CODE_DATA           *Data OPTIONAL
  )
{
  UINT32  PostCodeValue;

  PostCodeValue = GetPostCodeFromStatusCode (CodeType, Value);
  if (PostCodeValue != 0) {
    DEBUG ((DEBUG_INFO, "POSTCODE=<%02x>\n", PostCodeValue));
    PostCode (PostCodeValue);
  }

  if ((CodeType & EFI_STATUS_CODE_TYPE_MASK) == EFI_PROGRESS_CODE) {
    //
    // Print PROGRESS information into output buffer.
    //
    DEBUG ((DEBUG_INFO, "PROGRESS CODE: V%x I%x\n\r", Value, Instance));
  }

  return EFI_SUCCESS;
}
The main function is PostCodeStatusCodeReportWorker(). Since we are halted there, we can use the SourcePoint Symbols window to display the parameters on the stack:
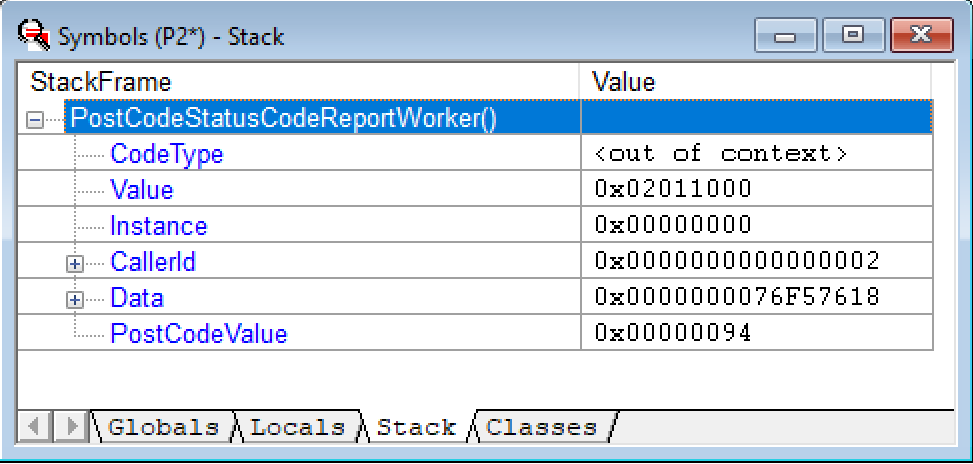
Note that the PostCodeValue is x’94’, as expected.
CodeType must be a global, and stored on the heap, and not on the stack, so it’s out of context.
Glancing over at the serial console, I walked from POSTCODE 90 to 92 to 94, and what came out the serial console near the end was:
PlatformBootManagerBeforeConsole

POSTCODE=<92>

PROGRESS CODE: v2010000 I0

PCI Bus First Scanning

POSTCODE=<94>
See that the progress code 2010000 appears as the “Value” parameter of type EFI_STATUS_CODE_VALUE from the stack window.
From the prefix text, you can surmise that POSTCODE 94 has something to do with “PCI Bus First Scanning”, but you have to look at the code to know more. And scanning through the build directory, we find that this text string comes from PciLib.c, within function PciHostBridgeEnumerator():
EFI_STATUS

PciHostBridgeEnumerator (

  IN EFI_PCI_HOST_BRIDGE_RESOURCE_ALLOCATION_PROTOCOL  *PciResAlloc

  )

{

  EFI_HANDLE                        RootBridgeHandle;

  PCI_IO_DEVICE                     *RootBridgeDev;

  EFI_STATUS                        Status;

  EFI_PCI_ROOT_BRIDGE_IO_PROTOCOL   *PciRootBridgeIo;

  UINT16                            MinBus;

  EFI_ACPI_ADDRESS_SPACE_DESCRIPTOR *Descriptors;

  EFI_ACPI_ADDRESS_SPACE_DESCRIPTOR *Configuration;

  UINT8                             StartBusNumber;

  LIST_ENTRY                        RootBridgeList;

  LIST_ENTRY                        *Link;

  if (FeaturePcdGet (PcdPciBusHotplugDeviceSupport)) {

    InitializeHotPlugSupport ();

  }

  InitializeListHead (&RootBridgeList);

  //

  // Notify the bus allocation phase is about to start

  //

  Status = NotifyPhase (PciResAlloc, EfiPciHostBridgeBeginBusAllocation);

  if (EFI_ERROR (Status)) {

    return Status;

  }

  DEBUG((EFI_D_INFO, "PCI Bus First Scanning\n"));
Using Intel Processor Trace can yield us this insight, as to how post codes are handled. I used the same means as in the prior blog to capture processor execution trace data in going to POSTCODE 94, and here is what I saw when I opened SourcePoint’s instruction “Call Chart”:
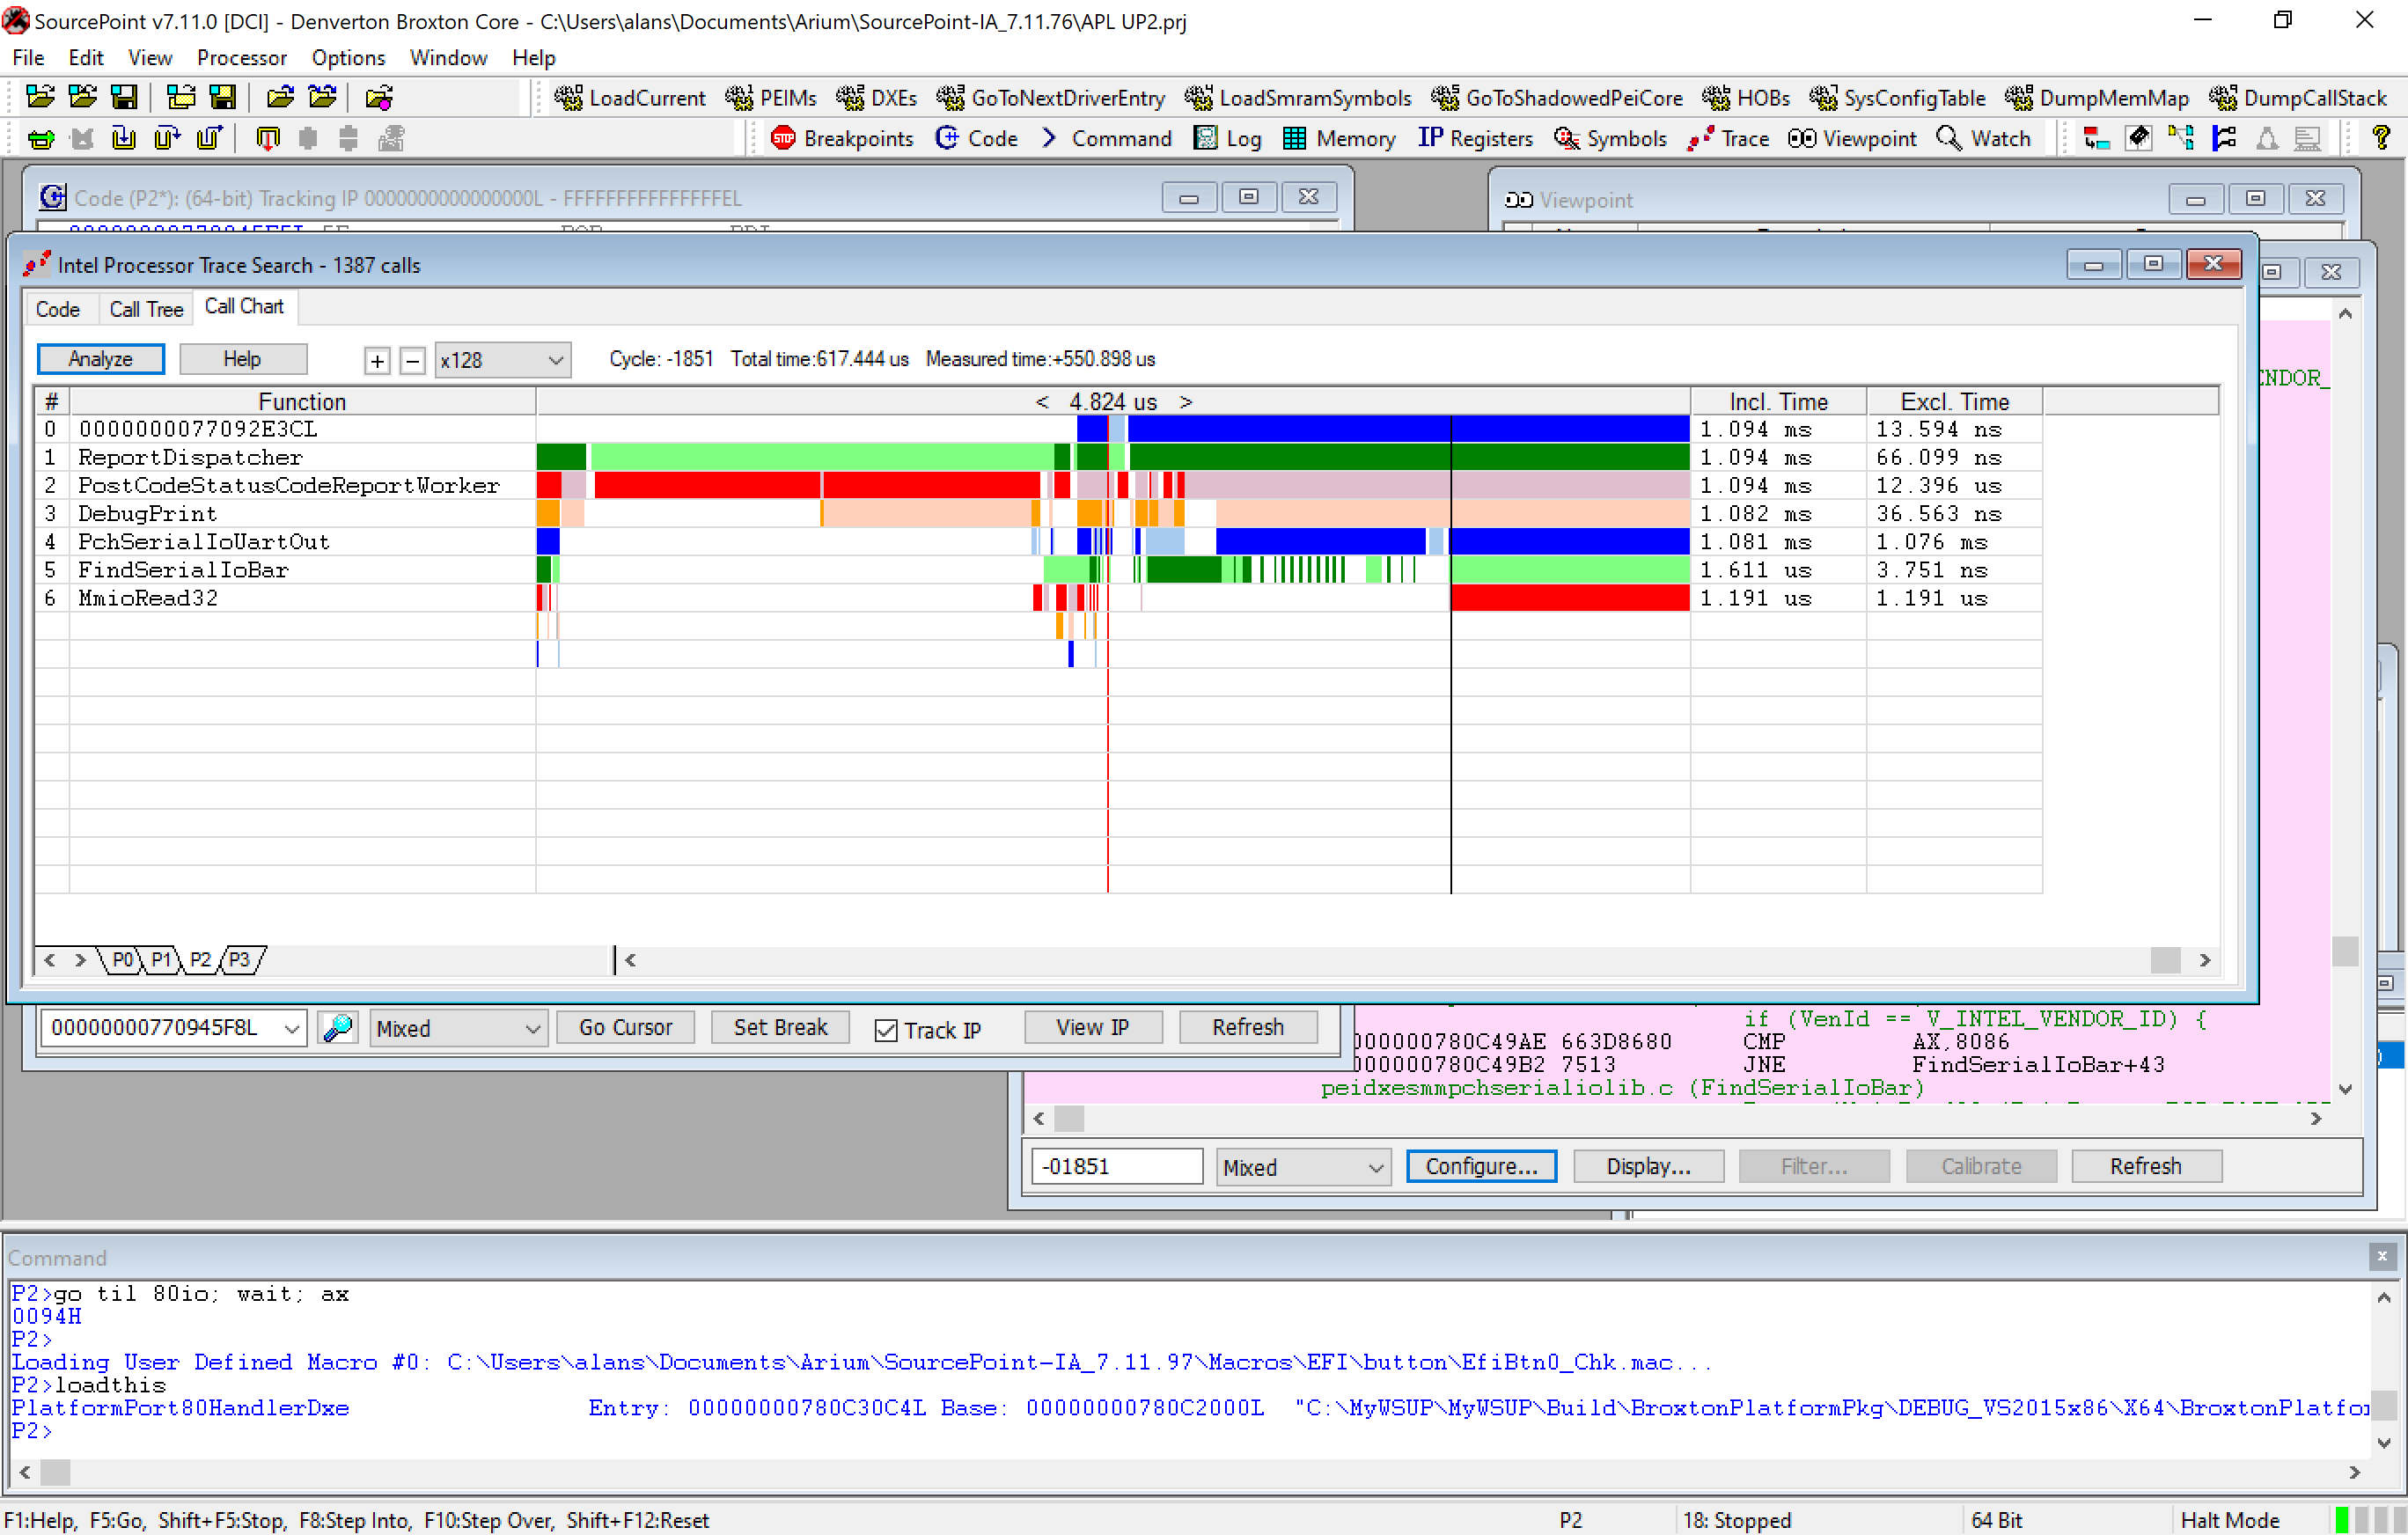
The black vertical line near the right marks the beginning of the entry to MmioRead32and its calling functions. At Cycle -1851 (that you can see near the top, under the title bar), code flow is shown to be ReportDispatcher -> PostCodeStatusCodeReportWorker -> DebugPrint ->PchSerialIoUartOut -> FindSerialIoBar -> MmioRead32. This seems intuitively correct, because for a debug image, the post codes are always also sent out the serial console.
Backing up just a bit to Cycle -1856, the new flow is below:
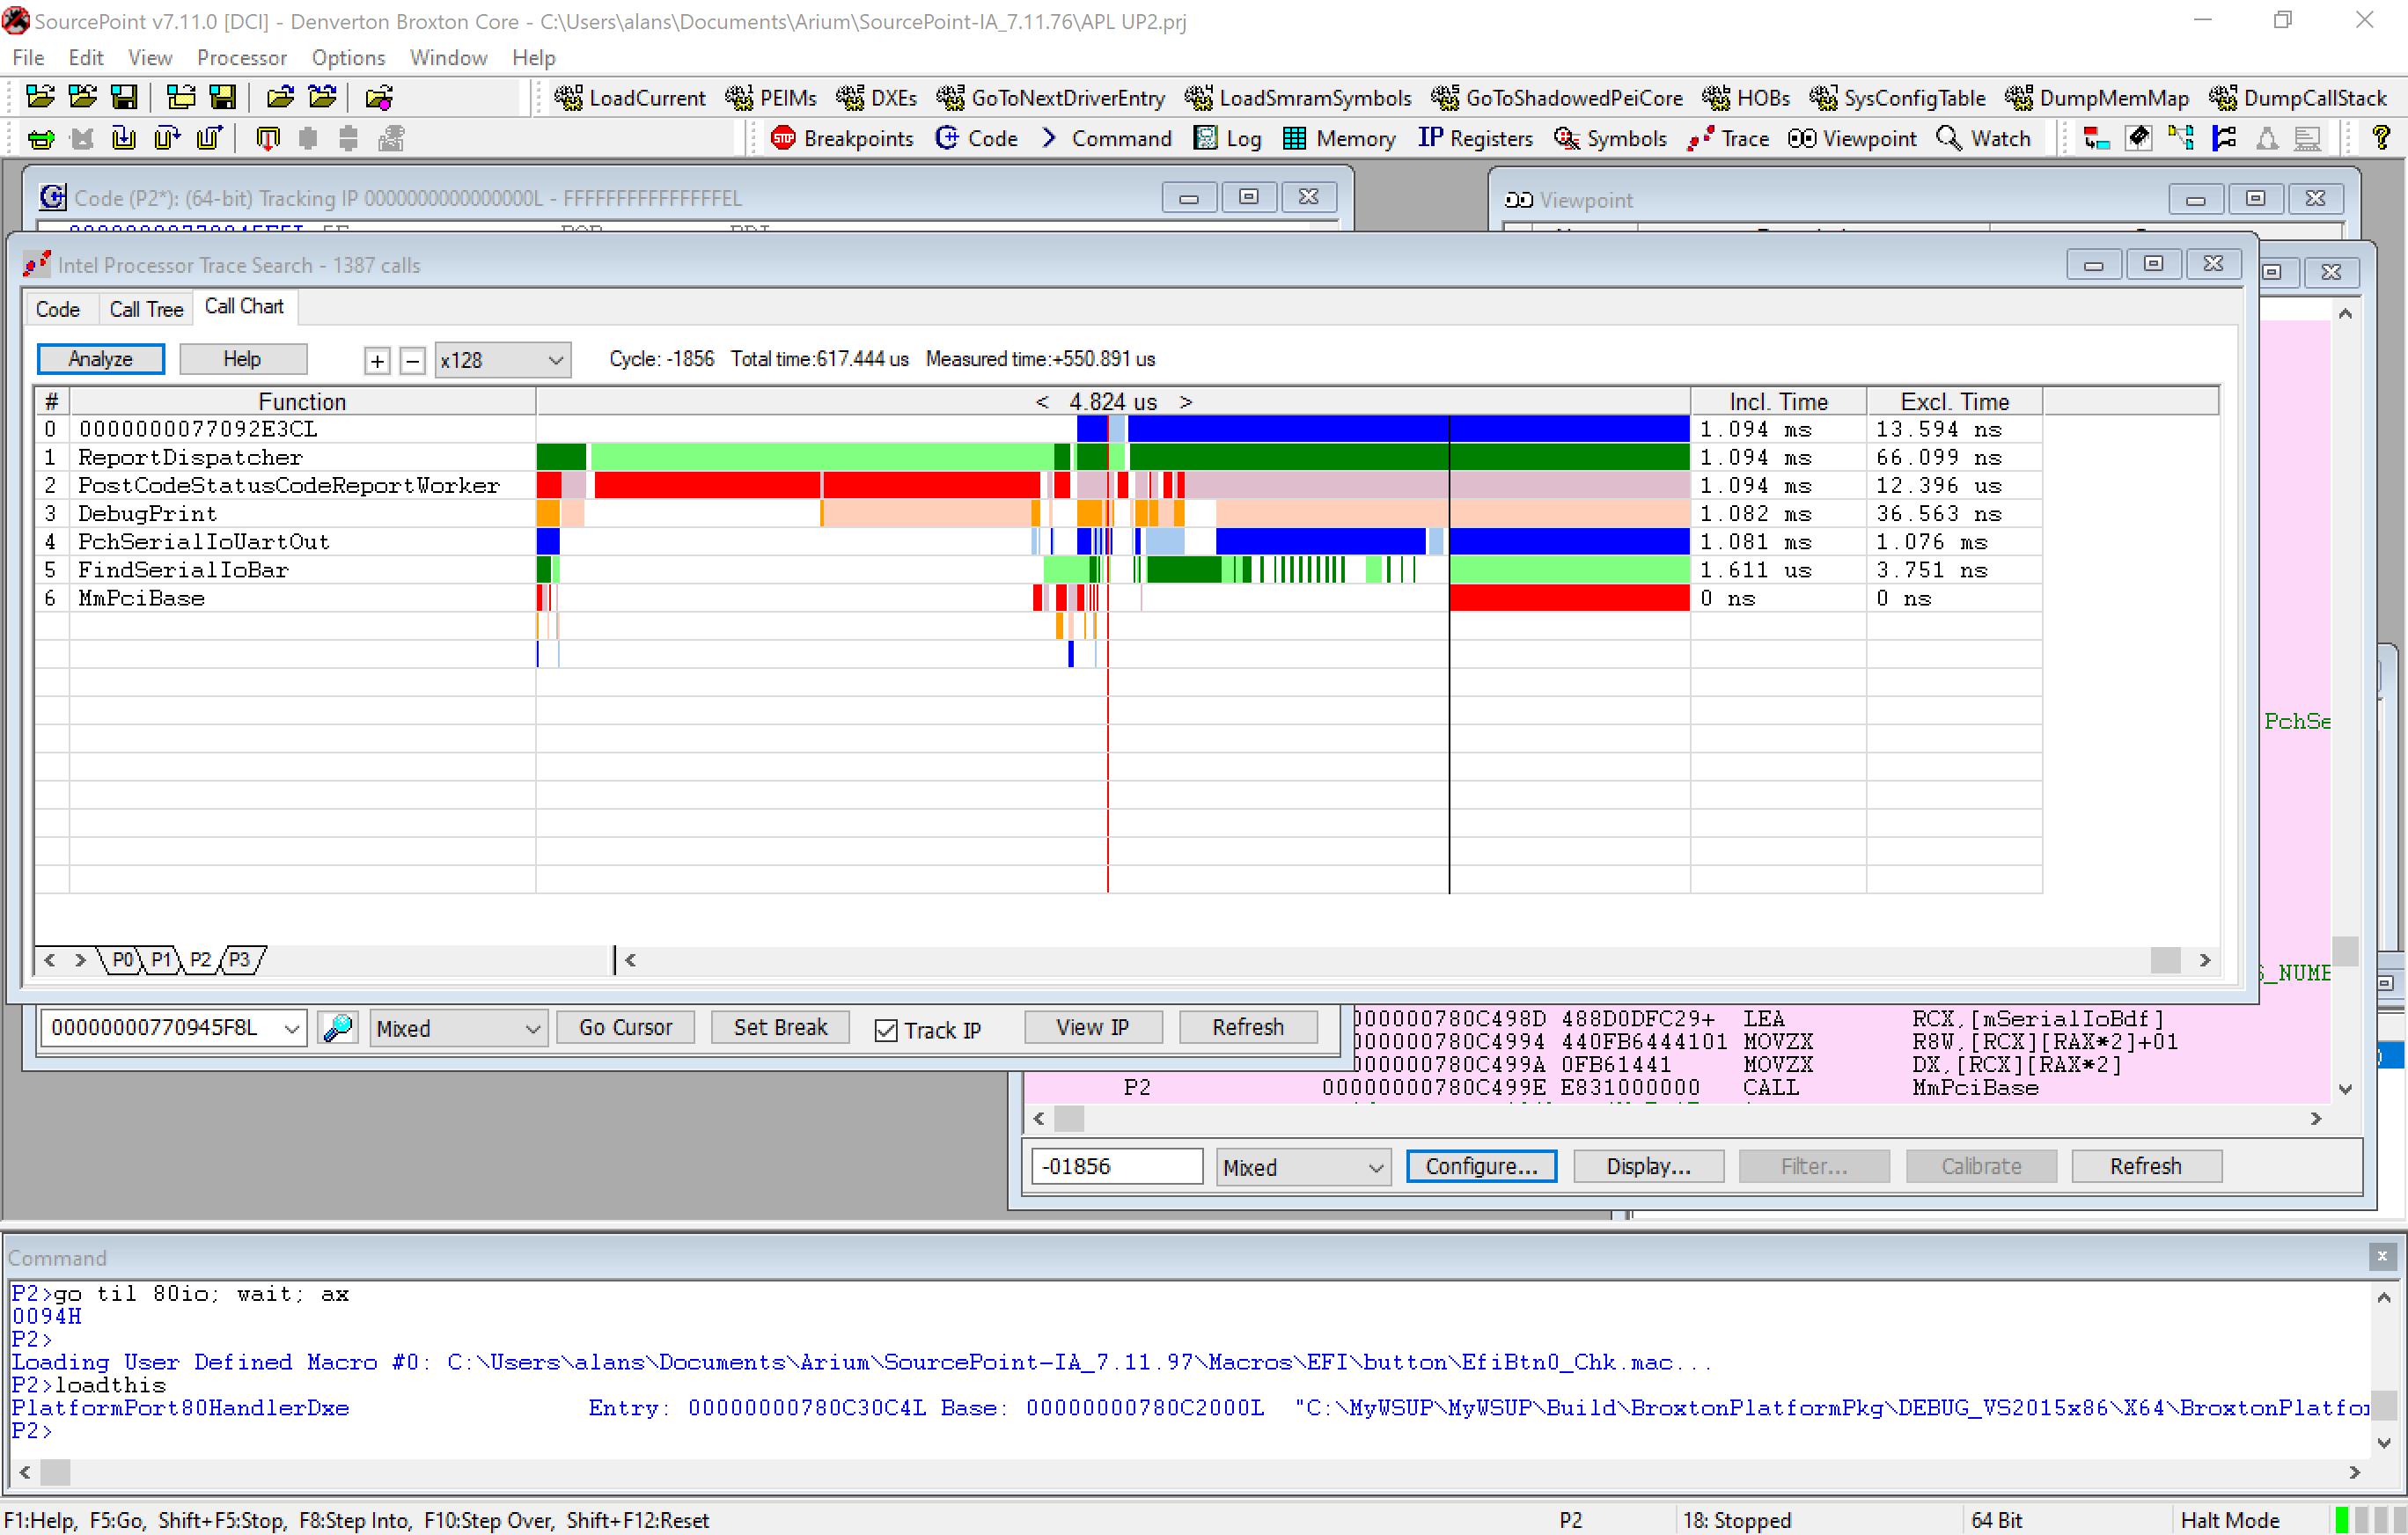
This differs only since it’s invoking MmPciBase just prior to the MmioRead32, as you can see. That also makes sense.
Sliding the instruction pointer to the left and watching the function calls evolve makes it apparent that the routine ReportDispatcher is setting up a call to PostCodeStatusCodeReportWorker, but does not directly invoke it. Looking at ReportDispatcher in some level of detail indicates a degree of complexity:
213     /**

214       Provides an interface that a software module can call to report a status code.

215

216       @param  Type             Indicates the type of status code being reported.

217       @param  Value            Describes the current status of a hardware or software entity.

218                                This included information about the class and subclass that is used to

219                                classify the entity as well as an operation.

220       @param  Instance         The enumeration of a hardware or software entity within

221                                the system. Valid instance numbers start with 1.

222       @param  CallerId         This optional parameter may be used to identify the caller.

223                                This parameter allows the status code driver to apply different rules to

224                                different callers.

225       @param  Data             This optional parameter may be used to pass additional data.

226

227       @retval EFI_SUCCESS           The function completed successfully

228       @retval EFI_DEVICE_ERROR      The function should not be completed due to a device error.

229

230     **/

231     EFI_STATUS

232     EFIAPI

233     ReportDispatcher (

234       IN EFI_STATUS_CODE_TYPE     Type,

235       IN EFI_STATUS_CODE_VALUE    Value,

236       IN UINT32                   Instance,

237       IN EFI_GUID                 *CallerId  OPTIONAL,

238       IN EFI_STATUS_CODE_DATA     *Data      OPTIONAL

239       )

240     {

241       LIST_ENTRY                    *Link;

242       RSC_HANDLER_CALLBACK_ENTRY    *CallbackEntry;

243       RSC_DATA_ENTRY                *RscData;

244       EFI_STATUS                    Status;

245       VOID                          *NewBuffer;

246

247       //

248       // Use atom operation to avoid the reentant of report.

249       // If current status is not zero, then the function is reentrancy.

250       //

251       if (InterlockedCompareExchange32 (&mStatusCodeNestStatus, 0, 1) == 1) {

252         return EFI_DEVICE_ERROR;

253       }

254

255       for (Link = GetFirstNode (&mCallbackListHead); !IsNull (&mCallbackListHead, Link);) {

256         CallbackEntry = CR (Link, RSC_HANDLER_CALLBACK_ENTRY, Node, RSC_HANDLER_CALLBACK_ENTRY_SIGNATURE);

257         //

258         // The handler may remove itself, so get the next handler in advance.

259         //

260         Link = GetNextNode (&mCallbackListHead, Link);

261         if ((CallbackEntry->Tpl == TPL_HIGH_LEVEL) || EfiAtRuntime ()) {

262           CallbackEntry->RscHandlerCallback (

263                            Type,

264                            Value,

265                            Instance,

266                            CallerId,

267                            Data

268                            );

269           continue;

270         }

271

272         //

273         // If callback is registered with TPL lower than TPL_HIGH_LEVEL, event must be signaled at boot time to possibly wait for

274         // allowed TPL to report status code. Related data should also be stored in data buffer.

275         //

276         CallbackEntry->EndPointer  = ALIGN_VARIABLE (CallbackEntry->EndPointer);

277         RscData = (RSC_DATA_ENTRY *) (UINTN) CallbackEntry->EndPointer;

278         CallbackEntry->EndPointer += sizeof (RSC_DATA_ENTRY);

279         if (Data != NULL) {

280           CallbackEntry->EndPointer += Data->Size;

281         }

282

283         //

284         // If data buffer is about to be used up (7/8 here), try to reallocate a buffer with double size, if not at TPL_HIGH_LEVEL.

285         //

286         if (CallbackEntry->EndPointer > (CallbackEntry->StatusCodeDataBuffer + (CallbackEntry->BufferSize / 8) * 7)) {

287           if (EfiGetCurrentTpl () < TPL_HIGH_LEVEL) {

288             NewBuffer = ReallocatePool (

289                           CallbackEntry->BufferSize,

290                           CallbackEntry->BufferSize * 2,

291                           (VOID *) (UINTN) CallbackEntry->StatusCodeDataBuffer

292                           );

293             if (NewBuffer != NULL) {

294               CallbackEntry->EndPointer = (EFI_PHYSICAL_ADDRESS) (UINTN) NewBuffer + (CallbackEntry->EndPointer - CallbackEntry->StatusCodeDataBuffer);

295               CallbackEntry->StatusCodeDataBuffer = (EFI_PHYSICAL_ADDRESS) (UINTN) NewBuffer;

296               CallbackEntry->BufferSize *= 2;

297             }

298           }

299         }

300

301         //

302         // If data buffer is used up, do not report for this time.

303         //

304         if (CallbackEntry->EndPointer > (CallbackEntry->StatusCodeDataBuffer + CallbackEntry->BufferSize)) {

305           continue;

306         }

307

308         RscData->Type      = Type;

309         RscData->Value     = Value;

310         RscData->Instance  = Instance;

311         if (CallerId != NULL) {

312           CopyGuid (&RscData->CallerId, CallerId);

313         }

314         if (Data != NULL) {

315           CopyMem (&RscData->Data, Data, Data->HeaderSize + Data->Size);

316         }

317

318         Status = gBS->SignalEvent (CallbackEntry->Event);

319         ASSERT_EFI_ERROR (Status);

320       }

321

322       //

323       // Restore the nest status of report

324       //

325       InterlockedCompareExchange32 (&mStatusCodeNestStatus, 1, 0);

326

327       return EFI_SUCCESS;
Digging into this a bit more, we see that ReportDispatcher() is defined further within ReportStatusCodeRouterSmm.c as:
EFI_SMM_STATUS_CODE_PROTOCOL mSmmStatusCodeProtocol = {

ReportDispatcher

};
I’ve gone back in the trace history, but I can’t connect the dots between the call to ReportDispatcher() and PciHostBridgeEnumerator() within PciLib.c, looking for the string “PCI Bus First Scanning”. I think I need to trace further back in time to associate the call to ReportDispatcher with the “PCI Bus First Scanning” message that precedes it. So, I increased the Processor Trace buffer to 512MB (Wow! And you can make it bigger, of course, based upon how much system memory you have; it just makes it slower based upon the amount of trace data you’re collecting) and, by also expanding the scale from x1 to x64 to zero in on the code area of interest, can now see the flow back to PciHostBridgeEnumerator():

The ReportDispatcher() code is to the right of the Trace discontinuity white gap (callback function) and the PCI routines about to do the heavy lifting are to the left.
When I did a “Go” on the target and stopped at the next POST code, which happens to be x’95’, the PuTTY console displays the output of the device discovery:
PciBus: Discovered PCI @ [00|00|00]


PciBus: Discovered PCI @ [00|00|02]

   BAR[0]: Type =  Mem64; Alignment = 0xFFFFF;  Length = 0x100000;      Offset = 0x10

   BAR[1]: Type =  Mem64; Alignment = 0x7FFFFF; Length = 0x800000;      Offset = 0x18

   BAR[2]: Type =  Mem64; Alignment = 0xFFF;    Length = 0x200; Offset = 0x20


PciBus: Discovered PCI @ [00|02|00]

   BAR[0]: Type =  Mem64; Alignment = 0xFFFFFF; Length = 0x1000000;     Offset = 0x10

   BAR[1]: Type = PMem64; Alignment = 0xFFFFFFF;        Length = 0x10000000;    Offset = 0x18

   BAR[2]: Type =   Io16; Alignment = 0x3F;     Length = 0x40;  Offset = 0x20


PciBus: Discovered PCI @ [00|0D|00]

   BAR[0]: Type =  Mem64; Alignment = 0xFFFFFF; Length = 0x1000000;     Offset = 0x10


PciBus: Discovered PCI @ [00|0D|01]

   BAR[0]: Type =  Mem64; Alignment = 0x1FFF;   Length = 0x2000;        Offset = 0x10

   BAR[1]: Type =  Mem64; Alignment = 0xFFF;    Length = 0x1000;        Offset = 0x18


PciBus: Discovered PCI @ [00|0D|02]

   BAR[0]: Type =  Mem32; Alignment = 0xFFF;    Length = 0x1000;        Offset = 0x10


PciBus: Discovered PCI @ [00|0D|03]

   BAR[0]: Type =  Mem64; Alignment = 0x1FFF;   Length = 0x2000;        Offset = 0x10

   BAR[1]: Type =  Mem64; Alignment = 0xFFF;    Length = 0x1000;        Offset = 0x18


PciBus: Discovered PCI @ [00|0E|00]

   BAR[0]: Type =  Mem64; Alignment = 0x3FFF;   Length = 0x4000;        Offset = 0x10

   BAR[3]: Type =  Mem64; Alignment = 0xFFFFF;  Length = 0x100000;      Offset = 0x20


PciBus: Discovered PCI @ [00|0F|00]

   BAR[0]: Type =  Mem64; Alignment = 0xFFF;    Length = 0x1000;        Offset = 0x10


PciBus: Discovered PCI @ [00|0F|01]

   BAR[0]: Type =  Mem64; Alignment = 0xFFF;    Length = 0x1000;        Offset = 0x10


PciBus: Discovered PCI @ [00|0F|02]

   BAR[0]: Type =  Mem64; Alignment = 0xFFF;    Length = 0x1000;        Offset = 0x10


PciBus: Discovered PCI @ [00|12|00]

   BAR[0]: Type =  Mem32; Alignment = 0x1FFF;   Length = 0x2000;        Offset = 0x10

   BAR[1]: Type =  Mem32; Alignment = 0xFFF;    Length = 0x100; Offset = 0x14

   BAR[2]: Type =   Io16; Alignment = 0x7;      Length = 0x8;   Offset = 0x18

   BAR[3]: Type =   Io16; Alignment = 0x3;      Length = 0x4;   Offset = 0x1C

   BAR[4]: Type =   Io16; Alignment = 0x1F;     Length = 0x20;  Offset = 0x20

   BAR[5]: Type =  Mem32; Alignment = 0xFFF;    Length = 0x800; Offset = 0x24


PciBus: Discovered PPB @ [00|13|00]


PciBus: Discovered PPB @ [00|13|02]


PciBus: Discovered PCI @ [02|00|00]

   BAR[0]: Type =   Io32; Alignment = 0xFF;     Length = 0x100; Offset = 0x10

   BAR[2]: Type =  Mem64; Alignment = 0xFFF;    Length = 0x1000;        Offset = 0x18

   BAR[3]: Type = PMem64; Alignment = 0x3FFF;   Length = 0x4000;        Offset = 0x20


PciBus: Discovered PPB @ [00|13|03]


PciBus: Discovered PPB @ [00|14|00]


PciBus: Discovered PPB @ [00|14|01]


PciBus: Discovered PCI @ [00|15|00]

   BAR[0]: Type =  Mem64; Alignment = 0xFFFF;   Length = 0x10000;       Offset = 0x10


PciBus: Discovered PCI @ [00|16|00]

   BAR[0]: Type =  Mem64; Alignment = 0xFFF;    Length = 0x1000;        Offset = 0x10

   BAR[1]: Type =  Mem64; Alignment = 0xFFF;    Length = 0x1000;        Offset = 0x18


PciBus: Discovered PCI @ [00|16|01]

   BAR[0]: Type =  Mem64; Alignment = 0xFFF;    Length = 0x1000;        Offset = 0x10

   BAR[1]: Type =  Mem64; Alignment = 0xFFF;    Length = 0x1000;        Offset = 0x18


PciBus: Discovered PCI @ [00|16|02]

   BAR[0]: Type =  Mem64; Alignment = 0xFFF;    Length = 0x1000;        Offset = 0x10

   BAR[1]: Type =  Mem64; Alignment = 0xFFF;    Length = 0x1000;        Offset = 0x18


PciBus: Discovered PCI @ [00|16|03]

   BAR[0]: Type =  Mem64; Alignment = 0xFFF;    Length = 0x1000;        Offset = 0x10

   BAR[1]: Type =  Mem64; Alignment = 0xFFF;    Length = 0x1000;        Offset = 0x18


PciBus: Discovered PCI @ [00|17|00]

   BAR[0]: Type =  Mem64; Alignment = 0xFFF;    Length = 0x1000;        Offset = 0x10

   BAR[1]: Type =  Mem64; Alignment = 0xFFF;    Length = 0x1000;        Offset = 0x18


PciBus: Discovered PCI @ [00|17|01]

   BAR[0]: Type =  Mem64; Alignment = 0xFFF;    Length = 0x1000;        Offset = 0x10

   BAR[1]: Type =  Mem64; Alignment = 0xFFF;    Length = 0x1000;        Offset = 0x18


PciBus: Discovered PCI @ [00|17|02]

   BAR[0]: Type =  Mem64; Alignment = 0xFFF;    Length = 0x1000;        Offset = 0x10

   BAR[1]: Type =  Mem64; Alignment = 0xFFF;    Length = 0x1000;        Offset = 0x18


PciBus: Discovered PCI @ [00|17|03]

   BAR[0]: Type =  Mem64; Alignment = 0xFFF;    Length = 0x1000;        Offset = 0x10

   BAR[1]: Type =  Mem64; Alignment = 0xFFF;    Length = 0x1000;        Offset = 0x18


PciBus: Discovered PCI @ [00|18|00]
All of which makes sense!
Remember that I’m using SourcePoint to access the Apollo Lake target using Intel’s Direct Connect Interface (DCI) interface, and not native XDP. So, there’s no need for a dedicated hardware probe; just use the specialty USB cable, and you’re in.
This is lots of fun! I’ll definitely be investigating this more deeply using SourcePoint and writing about it again.


