In Part 1 of this article series, I demonstrated the use of EXDI with DCI to explore the Windows hypervisor. In this article, we’ll take a first look at the Windows Secure Kernel.
In the first of this series, JTAG debug of Windows Hyper-V / Secure Kernel with WinDbg and EXDI: Part 1, we used the SourcePoint WinDbg tool to set VM Launch and VM Exit breakpoints, and then Intel Processor Trace to capture some of the instructions executed as we booted to Windows. Let’s look at these in more detail now.
As with before, we booted our AAEON UP Xtreme i11 board to the UEFI shell, then took control with SourcePoint with Intel Direct Connect Interface (DCI). After setting SourcePoint’s built-in VM Launch and VM Exit breakpoints, and turning on Intel PT, we ultimately ended up at the Windows desktop, and found ourselves in the hypervisor module (hvix64, for which we have no symbols, of course).
Editor’s note: the AMD equivalent of Intel’s hvix64 is hvax64.
Before we going through the steps necessary to debug and trace the low-level secure kernel and hypervisor code, it’s worthwhile just going through a quick intro of what we’ll be looking at.
The use of hypervisors at the foundation of modern operating systems is an innovation that has been driven by cybersecurity requirements. A hypervisor, by its very nature, is a specialized component of the modern OS that has privileges even higher than the kernel itself. Microsoft’s Hyper-V virtualization technology is used in a set of services entitled Virtualization-Based Security (VBS), that is the foundation of Device Guard, Hyper Guard, Credential Guard, and others.
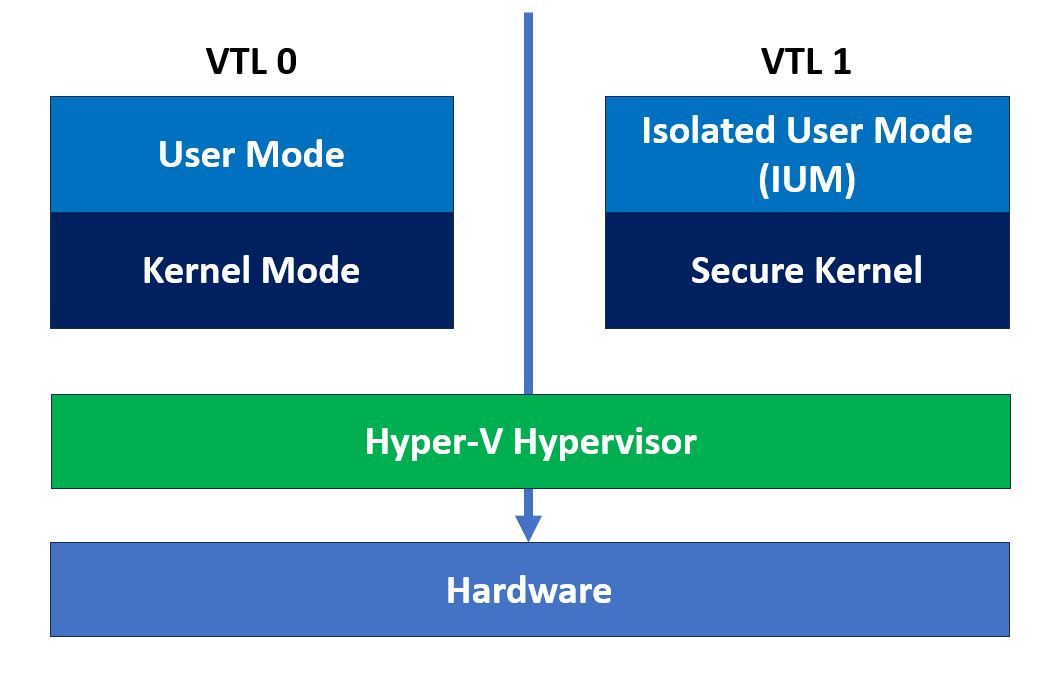
The Windows HV manifests itself in Virtual Trust Levels (VTLs), specifically VTL-0 (normal kernel) and VTL-1 (secure kernel). Visually, the architecture of the “new” Windows looks like this:
 If you’d like know more, I highly recommend the Windows Internals books. Also, Satoshi Tanda has published a number of related articles that are of great interest: https://tandasat.github.io/blog/.
To investigate these using SourcePoint, we’ll take steps one at a time:
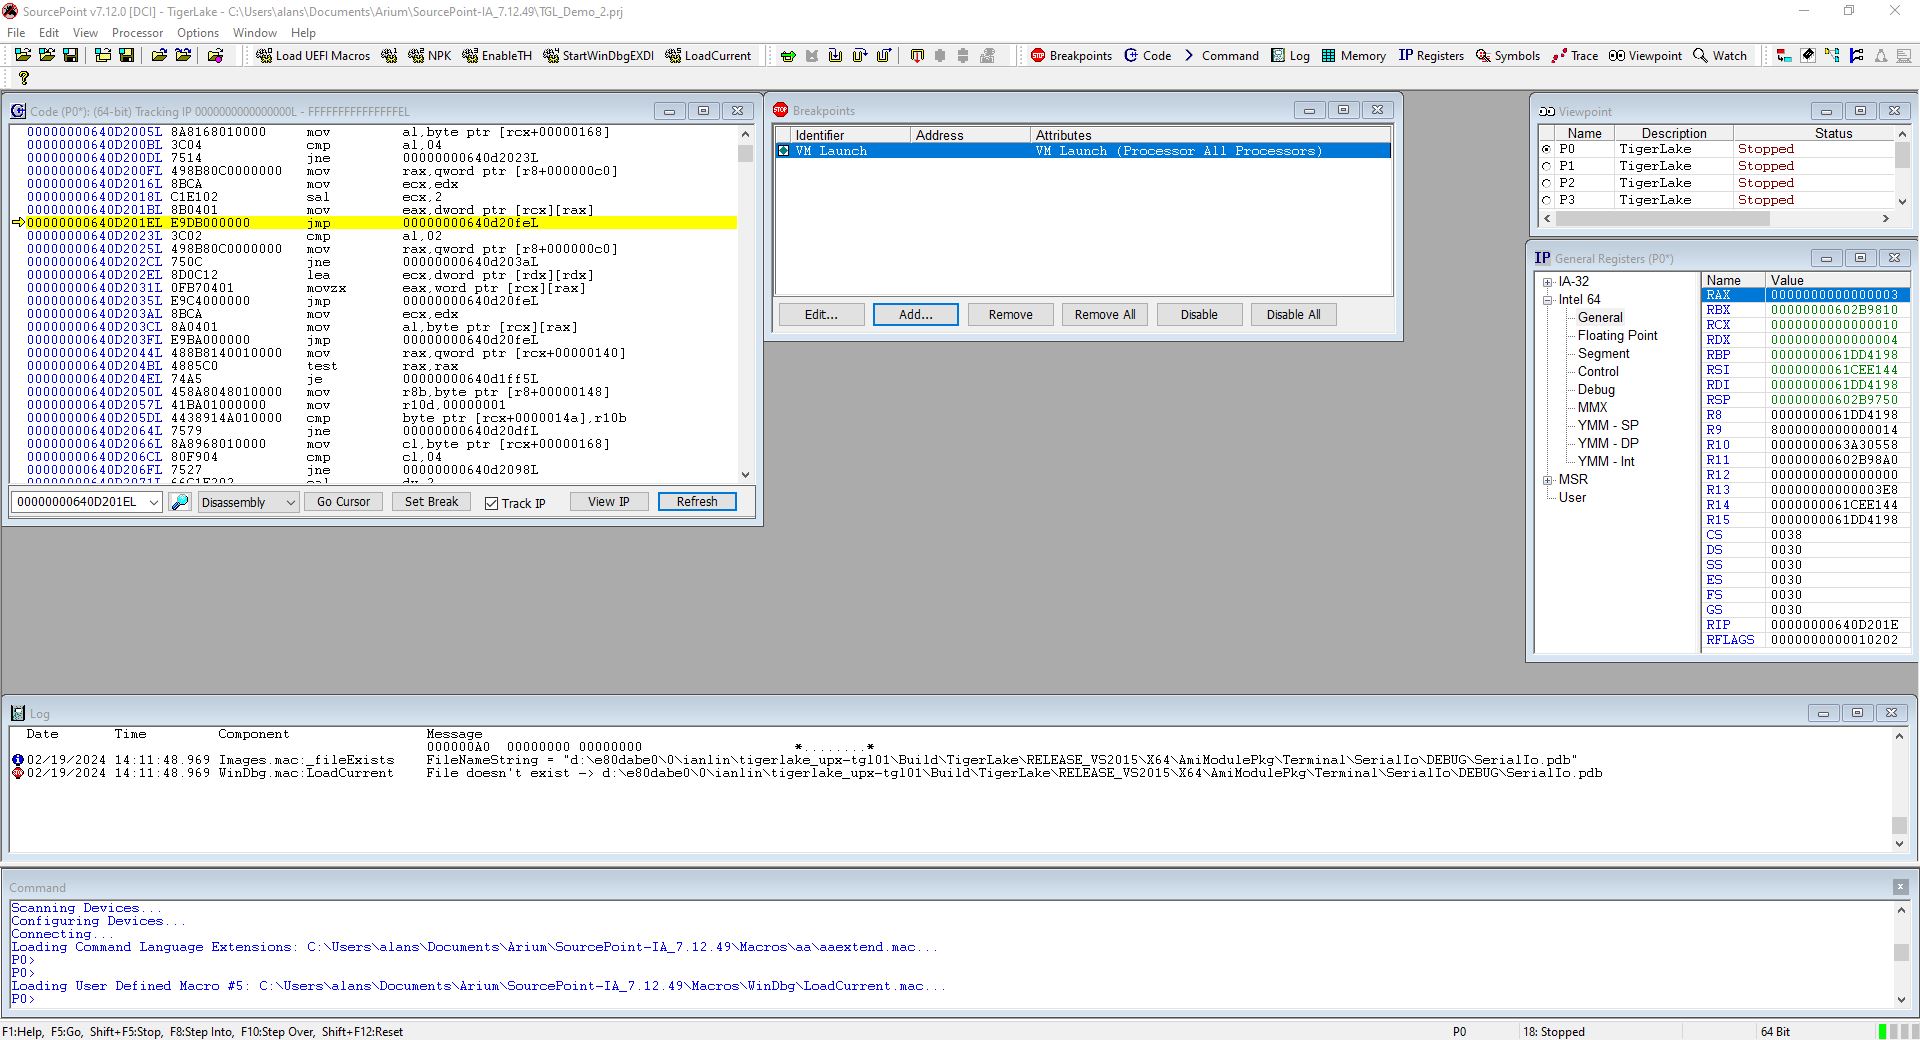
As before, boot to the UEFI shell, connect to the target with SourcePoint over DCI, insert a VM Launch breakpoint:
It is worthwhile noting that running the SourcePoint “LoadCurrent” macro gives you the build directory and the module name of the code that is at the current instruction pointer. I didn’t do the build, so I don’t have the source/symbols for this Tiger Lake board:
02/19/2024 14:11:48.969 Images.mac:_fileExists    FileNameString = "d:\e80dabe0\0\ianlin\tigerlake_upx-tgl01\Build\TigerLake\RELEASE_VS2015\X64\AmiModulePkg\Terminal\SerialIo\DEBUG\SerialIo.pdb"

02/19/2024 14:11:48.969 WinDbg.mac:LoadCurrent    File doesn't exist -> d:\e80dabe0\0\ianlin\tigerlake_upx-tgl01\Build\TigerLake\RELEASE_VS2015\X64\AmiModulePkg\Terminal\SerialIo\DEBUG\SerialIo.pdb
See my earlier blogs for more information on the AAEON Whiskey Lake board, which, with some work, does have Tianocore UEFI source/symbols available:
Back to the Tiger Lake board: then run the target until the VMLaunch breakpoint is hit:
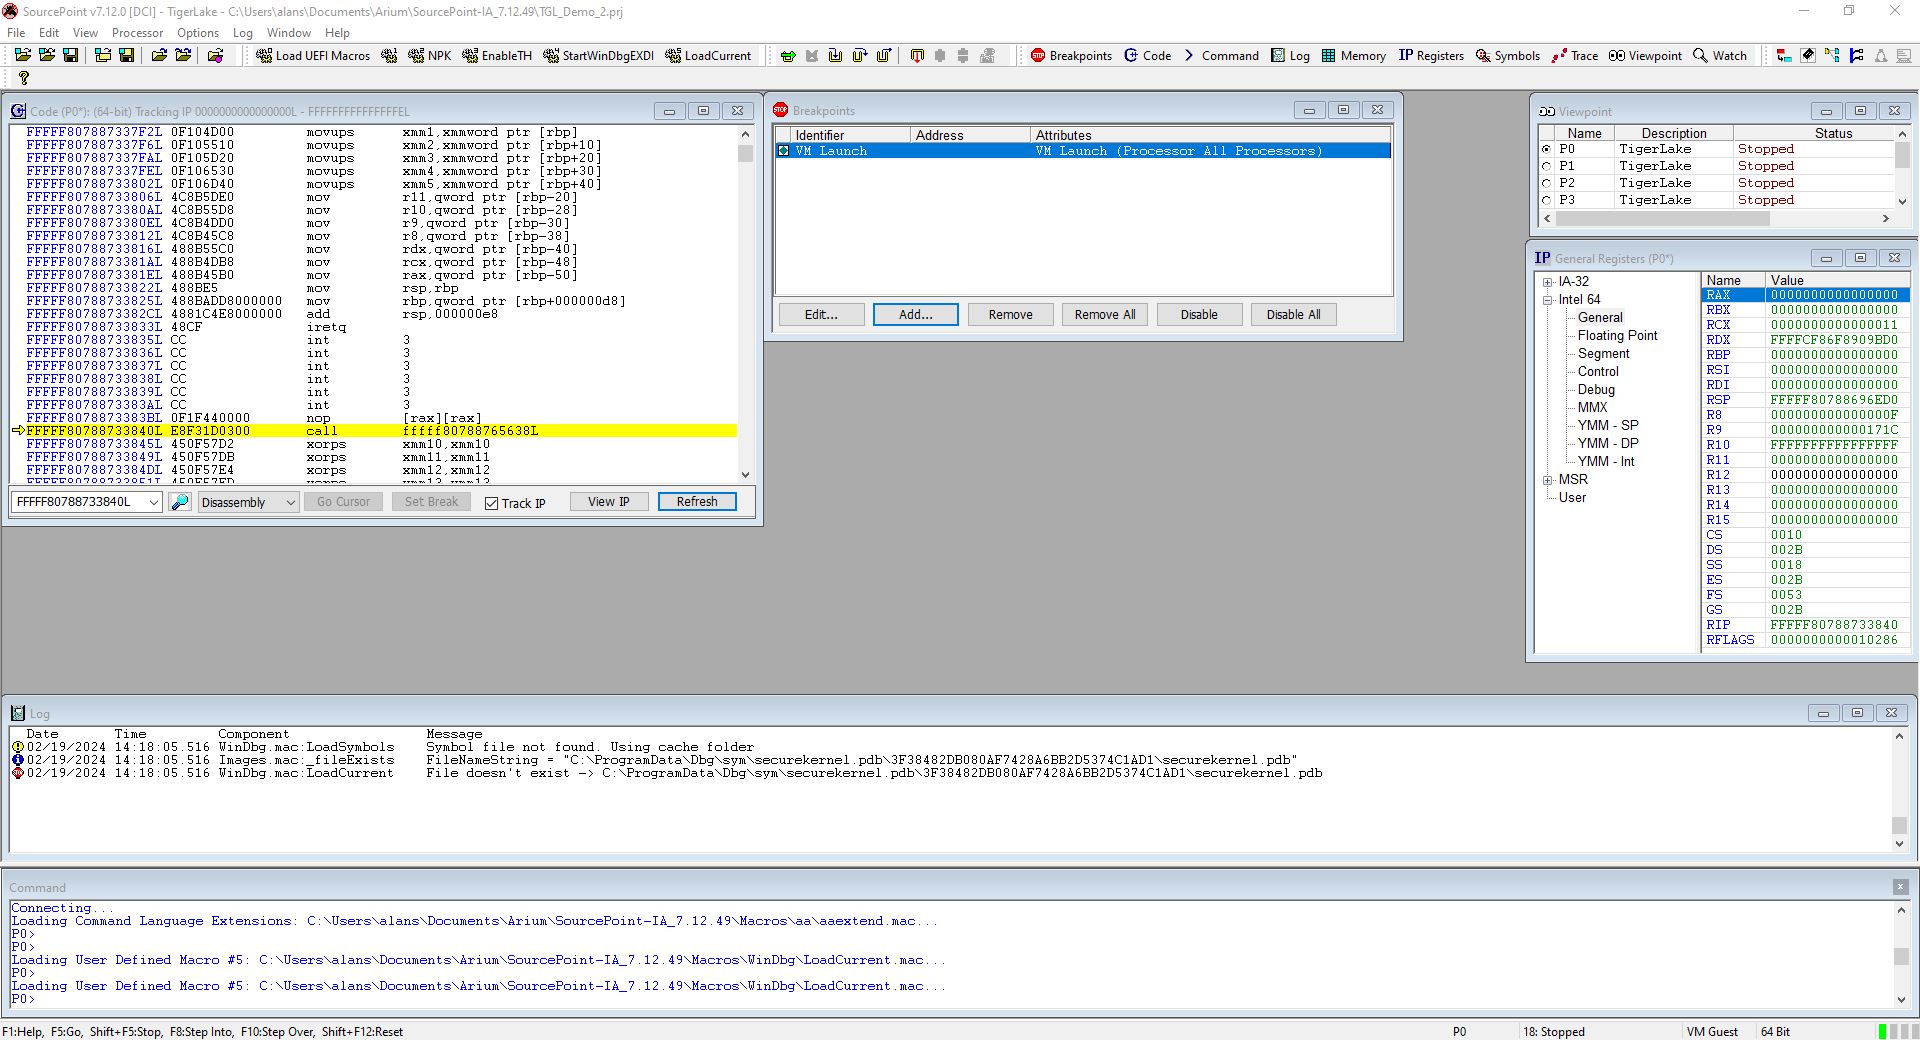
We can now debug the Secure Kernel (note from the Log window that the “LoadCurrent” macro cannot find the PDB, which is as expected):
02/19/2024 13:34:55.710 Images.mac:_fileExists    FileNameString = "srv*\securekernel.pdb\3F38482DB080AF7428A6BB2D5374C1AD1\securekernel.pdb"

02/19/2024 13:34:55.711 WinDbg.mac:LoadSymbols    Symbol file not found. Using cache folder

02/19/2024 13:34:55.711 Images.mac:_fileExists    FileNameString = "C:\ProgramData\Dbg\sym\securekernel.pdb\3F38482DB080AF7428A6BB2D5374C1AD1\securekernel.pdb"

02/19/2024 13:34:55.711 WinDbg.mac:LoadCurrent    File doesn't exist -> C:\ProgramData\Dbg\sym\securekernel.pdb\3F38482DB080AF7428A6BB2D5374C1AD1\securekernel.pdb
Debugging the Secure Kernel using SourcePoint WinDbg is fairly straightforward. All the standard run-control features work: single-step, Go To Cursor, set breakpoints, etc. Editor’s Note: for some reason, it is difficult to capture instruction trace (either LBR or Intel PT) leading up to the initial VMLaunch breakpoint – we’re working on it.
Note that SourcePoint says, at the bottom right, that the Secure Kernel is running in VM Guest mode. I find that interesting.
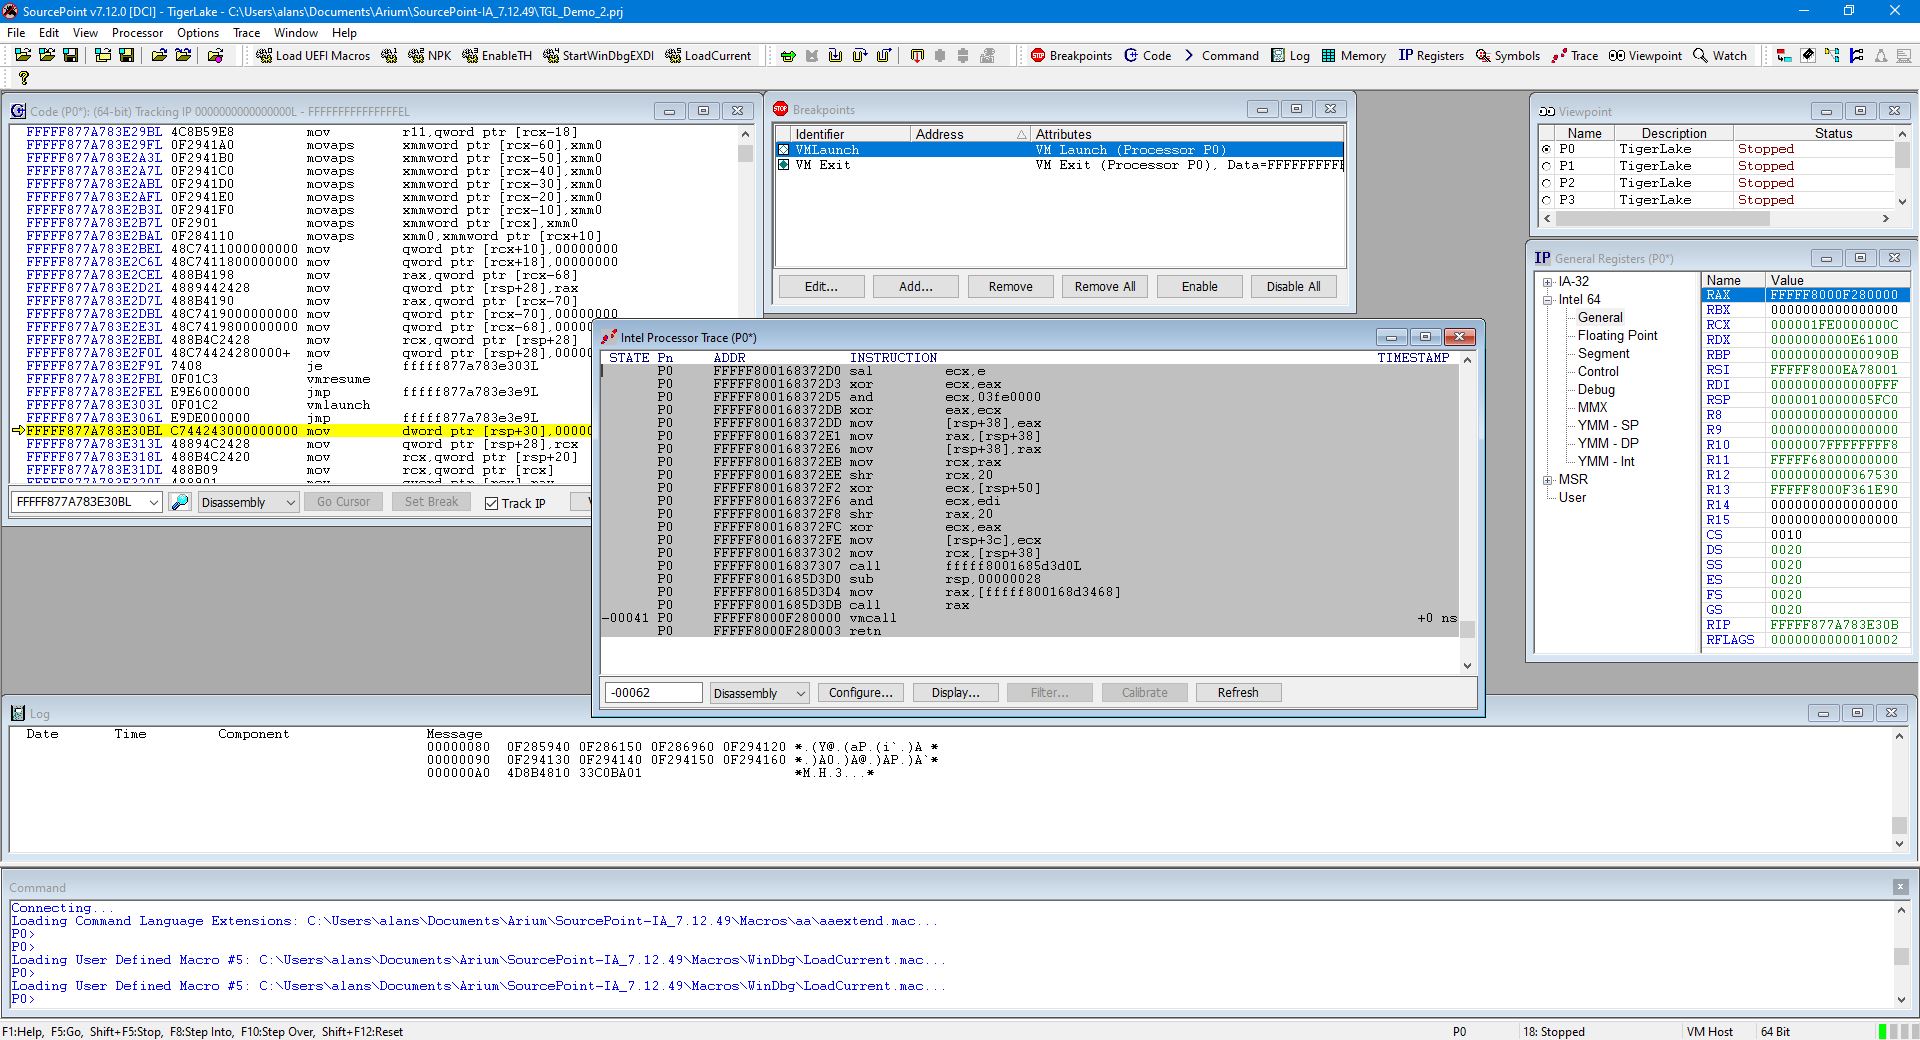
To see the first instantiation of the exit to the root partition, we uncheck the VM Launch breakpoint, and set a VM Exit breakpoint. We can then also turn on Intel PT. Then hit Go:
Note that we’re in VM Host mode.
Just for interest’s sake, here’s a snippet of instruction trace preceding the actual break:
P0     FFFFF80673107264 jne         fffff80673107256L
P0     FFFFF80673107256 mov         [rdx],rax
P0     FFFFF80673107259 inc         rax
P0     FFFFF8067310725C lea         rdx,[rdx+08]
P0     FFFFF80673107260 sub         rcx,00000001
P0     FFFFF80673107264 jne         fffff80673107256L
P0     FFFFF80673107256 mov         [rdx],rax
P0     FFFFF80673107259 inc         rax
P0     FFFFF8067310725C lea         rdx,[rdx+08]
P0     FFFFF80673107260 sub         rcx,00000001
P0     FFFFF80673107264 jne         fffff80673107256L
P0     FFFFF80673107256 mov         [rdx],rax
P0     FFFFF80673107259 inc         rax
P0     FFFFF8067310725C lea         rdx,[rdx+08]
P0     FFFFF80673107260 sub         rcx,00000001
P0     FFFFF80673107264 jne         fffff80673107256L
P0     FFFFF80673107266 jmp         fffff80673107283L
P0     FFFFF80673107283 mov         ecx,0000000c
P0     FFFFF80673107288 lea         rax,[rsp+44]
P0     FFFFF8067310728D mov         rdx,rdi
P0     FFFFF80673107290 cmp         ebx,ecx
P0     FFFFF80673107292 ja          fffff806731072b6L
P0     FFFFF806731072B6 mov         [rsp+28],rax
P0     FFFFF806731072BB xor         r9d,r9d
P0     FFFFF806731072BE xor         r8d,r8d
P0     FFFFF806731072C1 mov         [rsp+20],ebx
P0     FFFFF806731072C5 call        fffff806730f7264L
P0     FFFFF806730F7264 mov         [rsp+08],rbx
P0     FFFFF806730F7269 push        rdi
P0     FFFFF806730F726A sub         rsp,00000020
P0     FFFFF806730F726E xor         ebx,ebx
P0     FFFFF806730F7270 mov         rax,r8
P0     FFFFF806730F7273 mov         r8,rdx
P0     FFFFF806730F7276 mov         rdi,0000fffffffff000
P0     FFFFF806730F7280 mov         edx,ebx
P0     FFFFF806730F7282 mov         r10,0000007ffffffff8
P0     FFFFF806730F728C mov         r11,fffff68000000000
P0     FFFFF806730F7296 test        r8,r8
P0     FFFFF806730F7299 je          fffff806730f72a9L
P0     FFFFF806730F729B shr         r8,9                                                 -833.333 ns
P0     FFFFF806730F729F and         r8,r10
P0     FFFFF806730F72A2 mov         rdx,[r8][r11]
P0     FFFFF806730F72A6 and         rdx,rdi
P0     FFFFF806730F72A9 mov         r8,rbx
P0     FFFFF806730F72AC test        rax,rax
P0     FFFFF806730F72AF je          fffff806730f72bfL
P0     FFFFF806730F72BF movsxd      rax,ecx                                              -517.494 ns
P0     FFFFF806730F72C2 mov         edi,00000fff
P0     FFFFF806730F72C7 mov         [rsp+38],rax
P0     FFFFF806730F72CC lea         ecx,[r9+07]
P0     FFFFF806730F72D0 sal         ecx,e
P0     FFFFF806730F72D3 xor         ecx,eax
P0     FFFFF806730F72D5 and         ecx,03fe0000
P0     FFFFF806730F72DB xor         eax,ecx
P0     FFFFF806730F72DD mov         [rsp+38],eax
P0     FFFFF806730F72E1 mov         rax,[rsp+38]
P0     FFFFF806730F72E6 mov         [rsp+38],rax
P0     FFFFF806730F72EB mov         rcx,rax
P0     FFFFF806730F72EE shr         rcx,20
P0     FFFFF806730F72F2 xor         ecx,[rsp+50]
P0     FFFFF806730F72F6 and         ecx,edi
P0     FFFFF806730F72F8 shr         rax,20
P0     FFFFF806730F72FC xor         ecx,eax
P0     FFFFF806730F72FE mov         [rsp+3c],ecx
P0     FFFFF806730F7302 mov         rcx,[rsp+38]
P0     FFFFF806730F7307 call        fffff8067311d3d0L
P0     FFFFF8067311D3D0 sub         rsp,00000028
P0     FFFFF8067311D3D4 mov         rax,[fffff80673193468]
P0     FFFFF8067311D3DB call        rax
P0     FFFFF8066BB70000 vmcall                                                                 +0 ns
P0     FFFFF8066BB70003 retn
This is a tiny fraction of the possible code trace. A 16kB Intel PT buffer can contain 10s of microseconds of execution trace. In practice, we can create as large a buffer as want (2GB is do-able). It just takes proportionately longer to extract the data from target system RAM for display and analysis. Note that the instruction flow is timestamped.
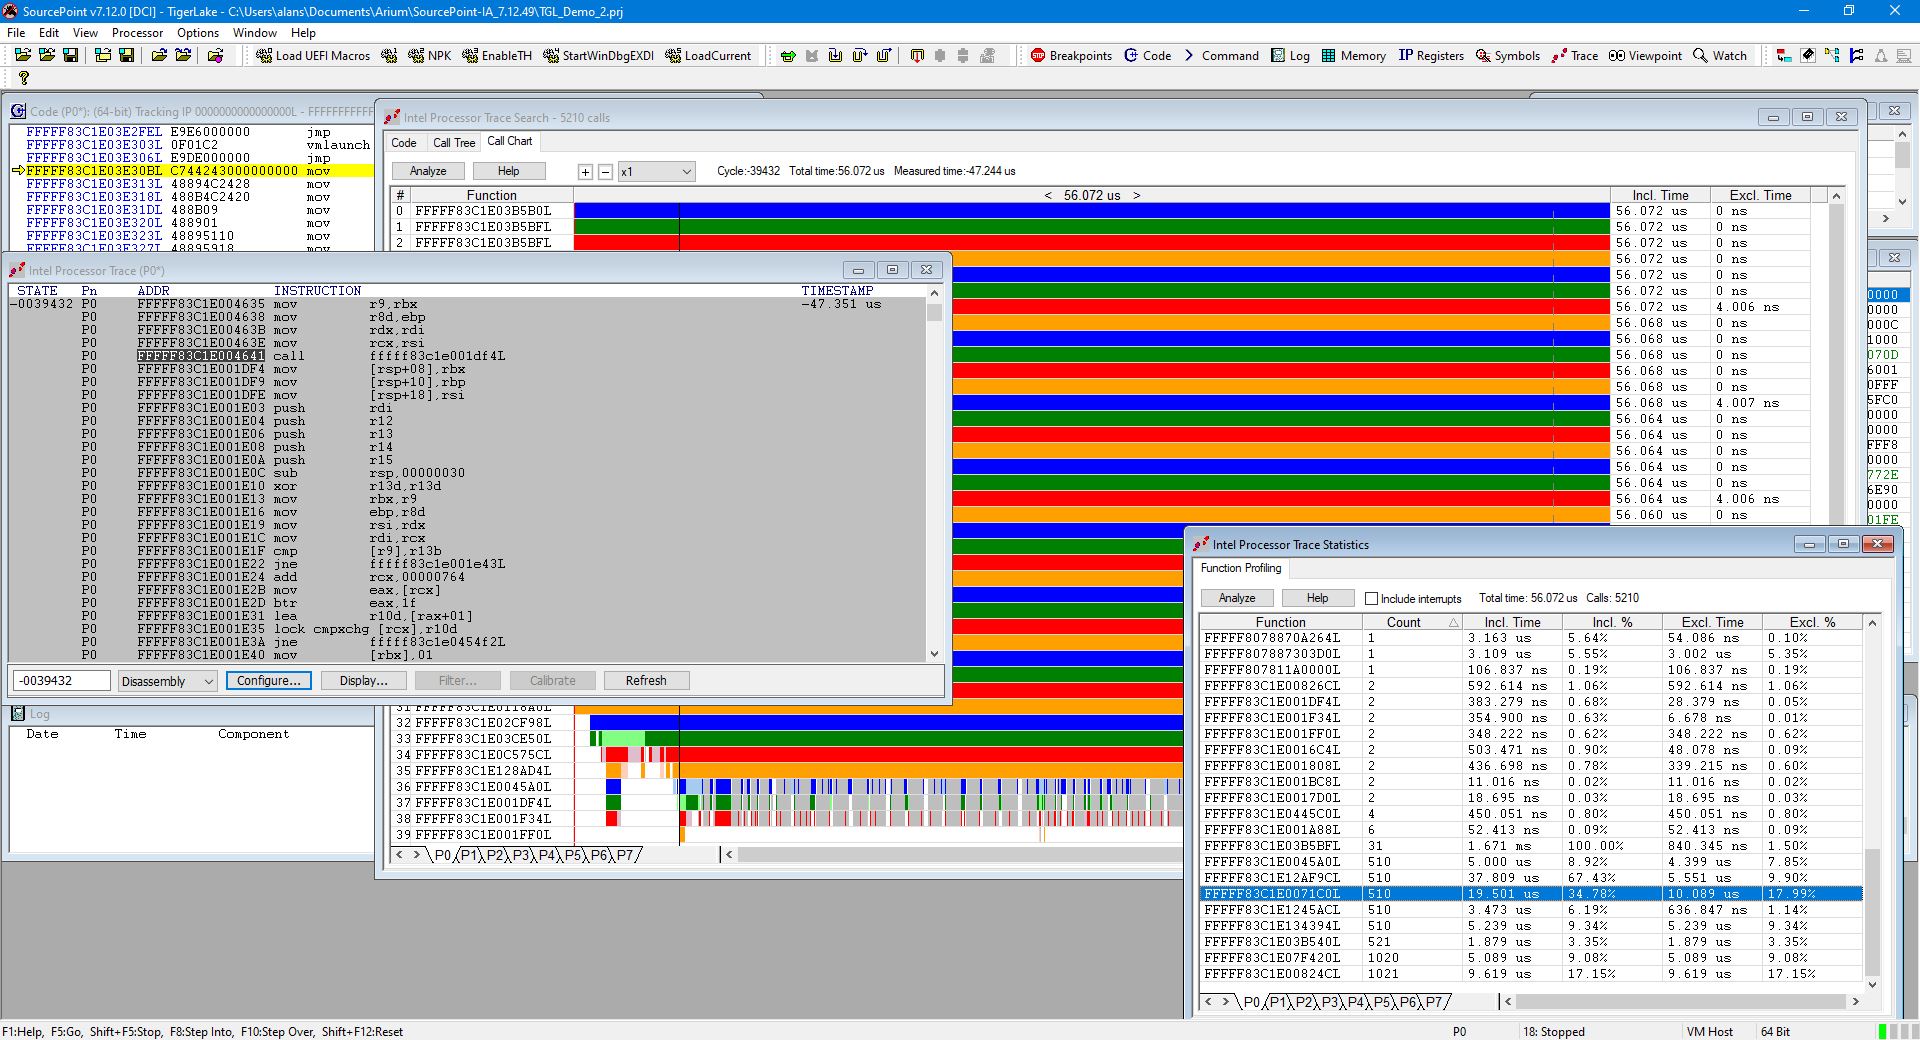
Even though we don’t have the securekernel.pdb and hvix64.pdb symbol files, we can look at the Call Tree to see a visual display of where the hypervisor is spending its time:
The timing profile is fascinating. Look at the SourcePoint Intel Processor Trace window, the Intel PT Search Call Chart, and the Intel PT Statistics window. There’s a lot to be learned here.
In an upcoming blog, I’ll write about researching the Secure Kernel and Hypervisor using both Intel PT and Architectural Event Trace (AET). Using these two trace technologies together will allow us to capture events such as interrupts, MSR reads and writes (especially useful for machine checks), SMI, NMI, and others, all with instruction trace so we can see the code executed leading up to the event. AET in particular also supports Code and Data breakpoint events: these implement microarchitectural changes in Intel CPUs that treat breakpoints as events, and don’t actually halt the target. If you want to see AET in action, I’d recommend the webinar I did a few years ago with the UEFI Forum: UEFI Debug with Intel Architectural Event Trace. Starting about 25 minutes in is the demonstration of an AET Code Breakpoint. It’s pretty cool.


