
Architectural Event Trace (AET) is the flip side of the coin with Intel Processor Trace (Intel PT): the latter captures execution/instruction trace, whereas the former captures events. This article is a first detailed exploration of the use of AET for debugging and reverse engineering within the Windows normal kernel and the secure kernel.
First a quick introduction, for those who may be unfamiliar: Intel PT is execution trace, and is supported by most modern Intel CPUs. Once activated on a target, it captures instruction trace data in very compact form, and places it into an allocated buffer in system memory. The SourcePoint debugger uses JTAG to retrieve the trace data from system memory, and displays it in several useful ways, most notably in a meaningful code context. If you’d like to know more about how to use Intel PT to trace Windows, read my blog at WinDbg with Intel Processor Trace, or for even more detail watch my Off By One Security stream hosted by Stephen Sims, at about 43 minutes into the recording: https://www.youtube.com/watch?v=9utI4qKCWH4.
AET uses the Intel Trace Hub, and it captures events. It can only be enabled via JTAG, so it’s not a very well-known technology; but it is extremely powerful. One of the few detailed public disclosures on AET is on my webinar with the UEFI Forum: https://www.youtube.com/watch?v=pHSvcO0ogdc.
So, let’s get started. For these experiments, I’m using the AAEON UP Xtreme i11 with Hyper-V and VBS enabled. For more information on how to set this up, see our Quick Start Guide and Getting Started Guide.
First, let’s turn AET on with SourcePoint. Open a Trace window, and set up the Trace Configuration. We’ll use the below:
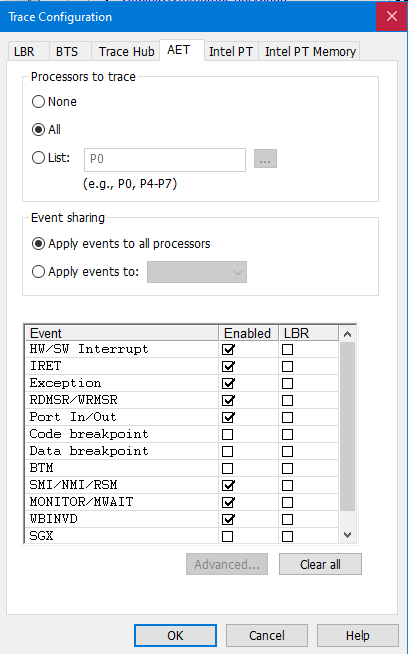
We can turn on LBR for each or all of the events, so that we can see the instruction traceback leading up to the event, for at least the last 200-300 instructions. But, this can cause bottlenecks, especially when capturing a lot of events, so I’ll just write a further blog on that in the future.
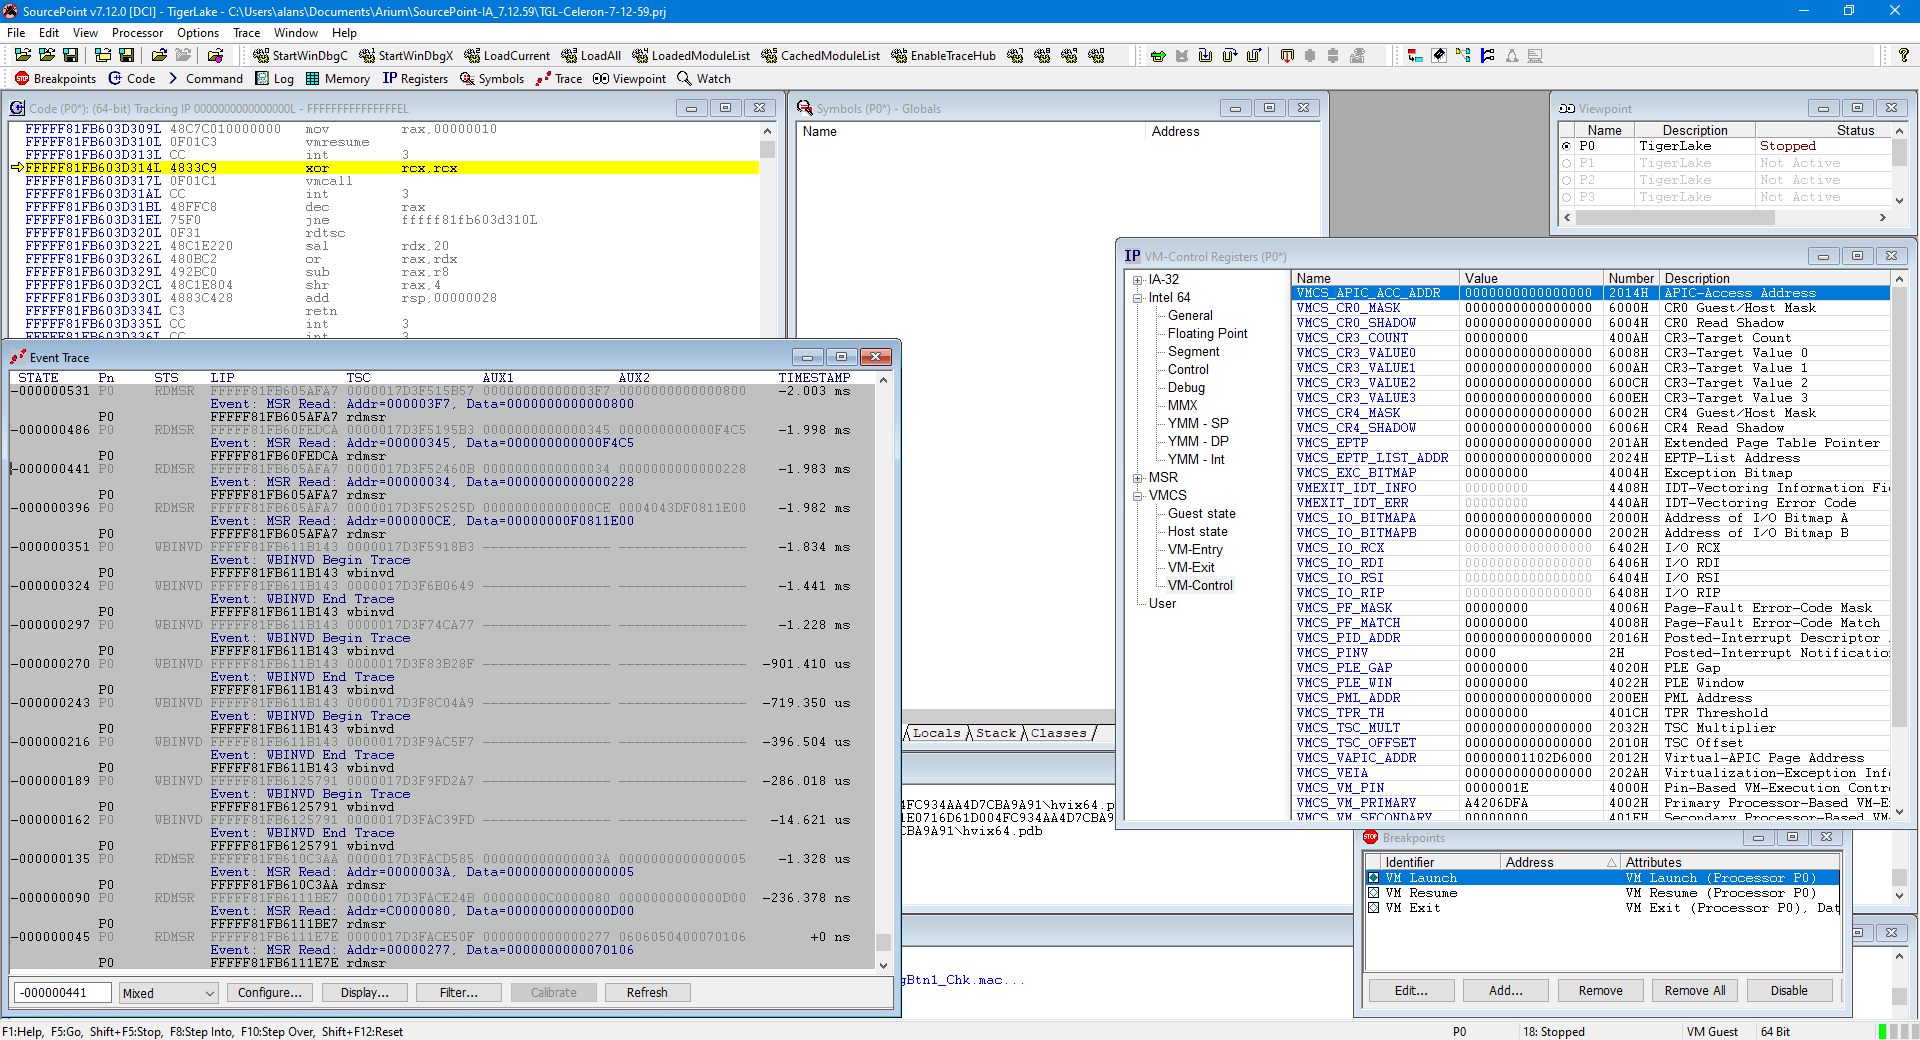
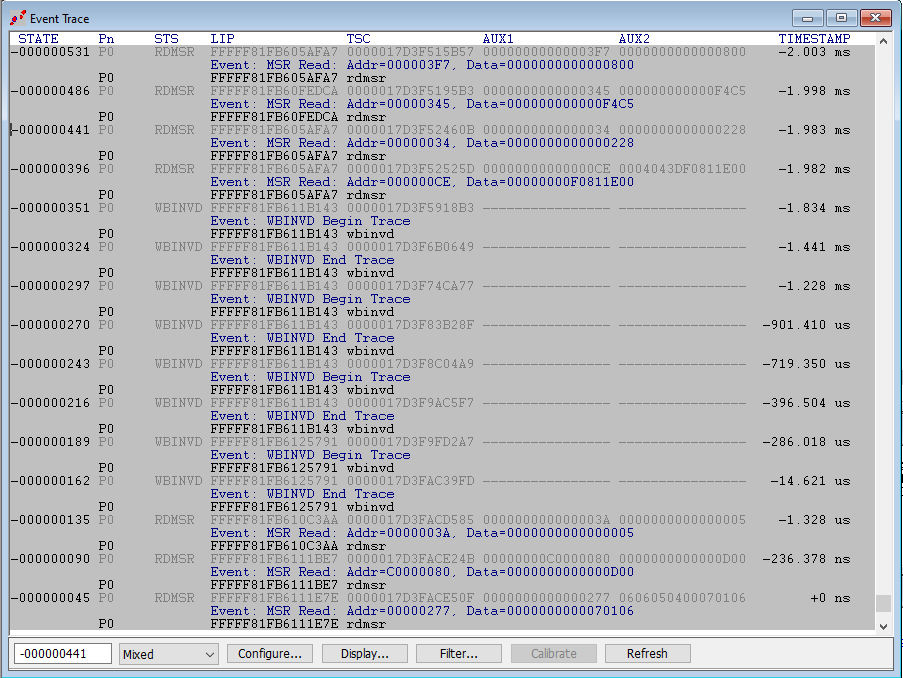
To explore events occurring at various stages of the Windows boot process, we’ll halt at the UEFI shell as before, place a VM Launch breakpoint, and hit Go. As expected, we land in hvix64. Here’s the event trace leading up to hitting the first VM Launch breakpoint, where the hypervisor is launched:
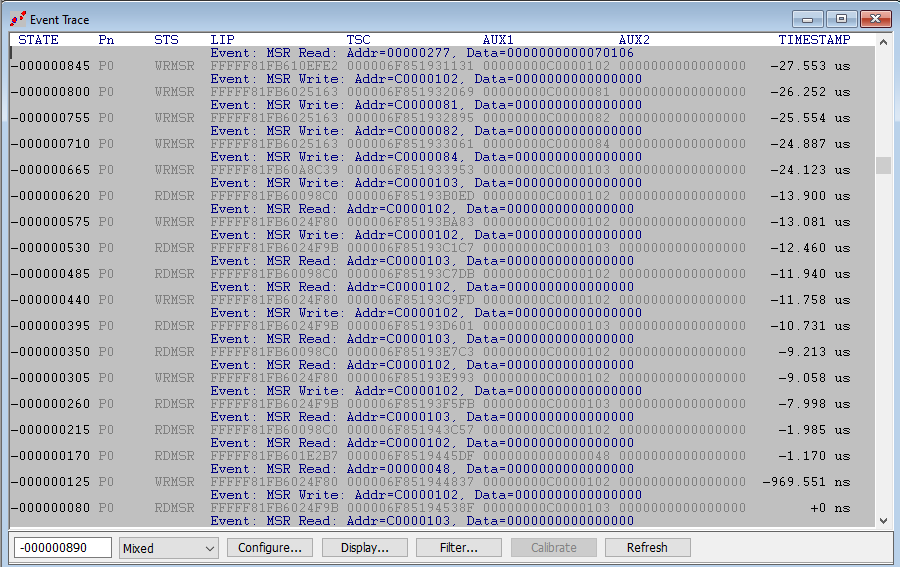
Let’s take a closer look at the actual event trace. The last event before hitting the VM Launch breakpoint is a RDMSR at address x’277, reading a value of x’70106:
You can go into the SourcePoint MSR Register view, use the “Find MSR” command to see that it’s the IA32_PAT register, and do an Expand on it to see the fact that yes, it is set to x’70106:
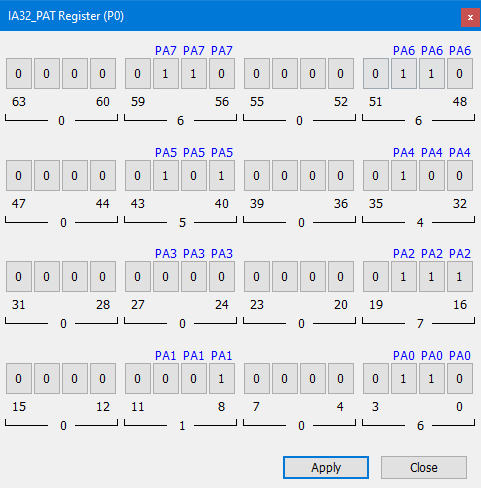
Pretty cool.
This RDMSR is preceded by two other MSR reads, for x’C0000080 (IA32_EFER), x’3A (MSR_FEATURE_CONTROL), and a number of WBINVD instructions. Again, you can use SourcePoint’s MSR Find command to look up more information on these, or slog through the Intel SDM.
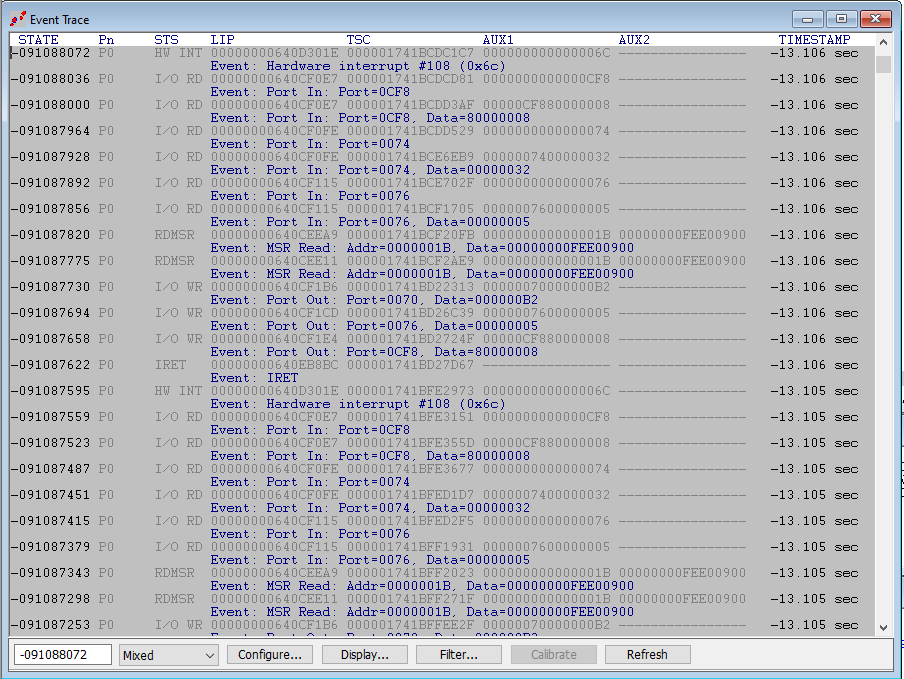
If you have a copy of SourcePoint, you can trace all the way back to the beginning of the UEFI shell, learning about the events that happen on the way. You’ll see Port In/Out instructions; Hardware interrupts, and IRET instructions; For interest, the first events that happen after the Go from the UEFI shell are as follows, about 13 seconds back in this instance:
Hitting Go again will break at the 2nd VM Launch breakpoint, and we are in hvloader. The event trace leading right up to the break is below:
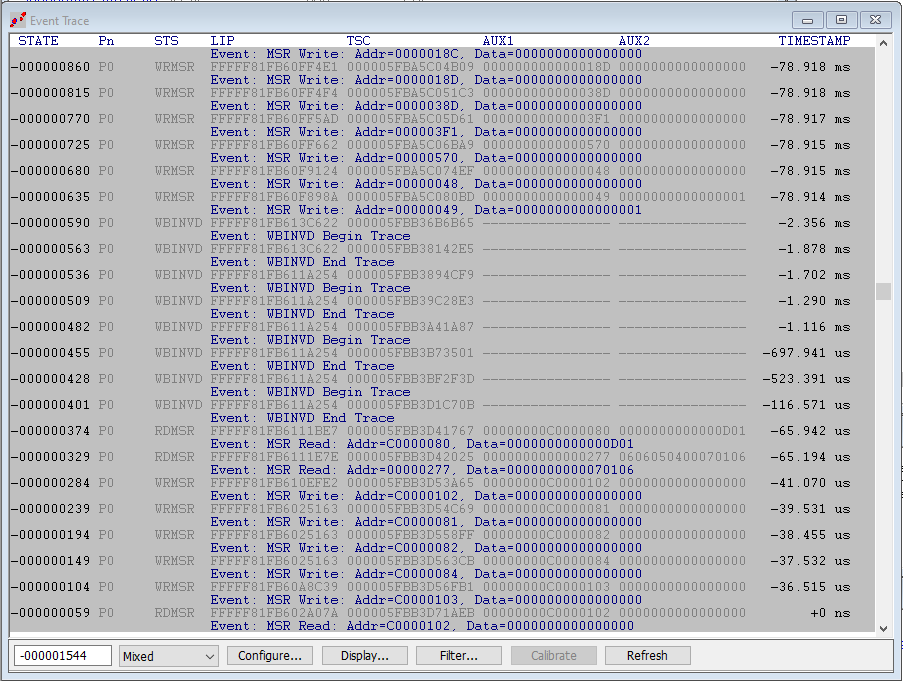
The behavior is somewhat similar, but this time there are far fewer events; the second VM Launch breakpoint is hit quite quickly. But check out the WRMSR to Addr=00000570; this is the RTIT_CTL register, and Windows is setting it to zero. Microsoft is trying to turn off Intel PT. 😊
One more time, hit Go: this lands you in the Secure Kernel, in VM Guest mode, as we know from previous editions of this blog. Here’s a sample of the event trace:
Just some MSR Reads and Writes are visible. Not much code is executed.
Now things become interesting. With the hypervisor active, we need to be aware of the fact that the target can transition from Guest to Host to Guest any time asynchronously; a VM Exit that happens for any reason can cause that. And SourcePoint (at least as of the time of this writing) cannot read Host mode system memory while in Guest mode, so although we can see the events happening, we cannot actually read the instruction address and see the instruction executed.
We can see this in action by doing a VM Exit and then hitting Go, at some point landing in the VTL 0 kernel (ntkrnlmp):
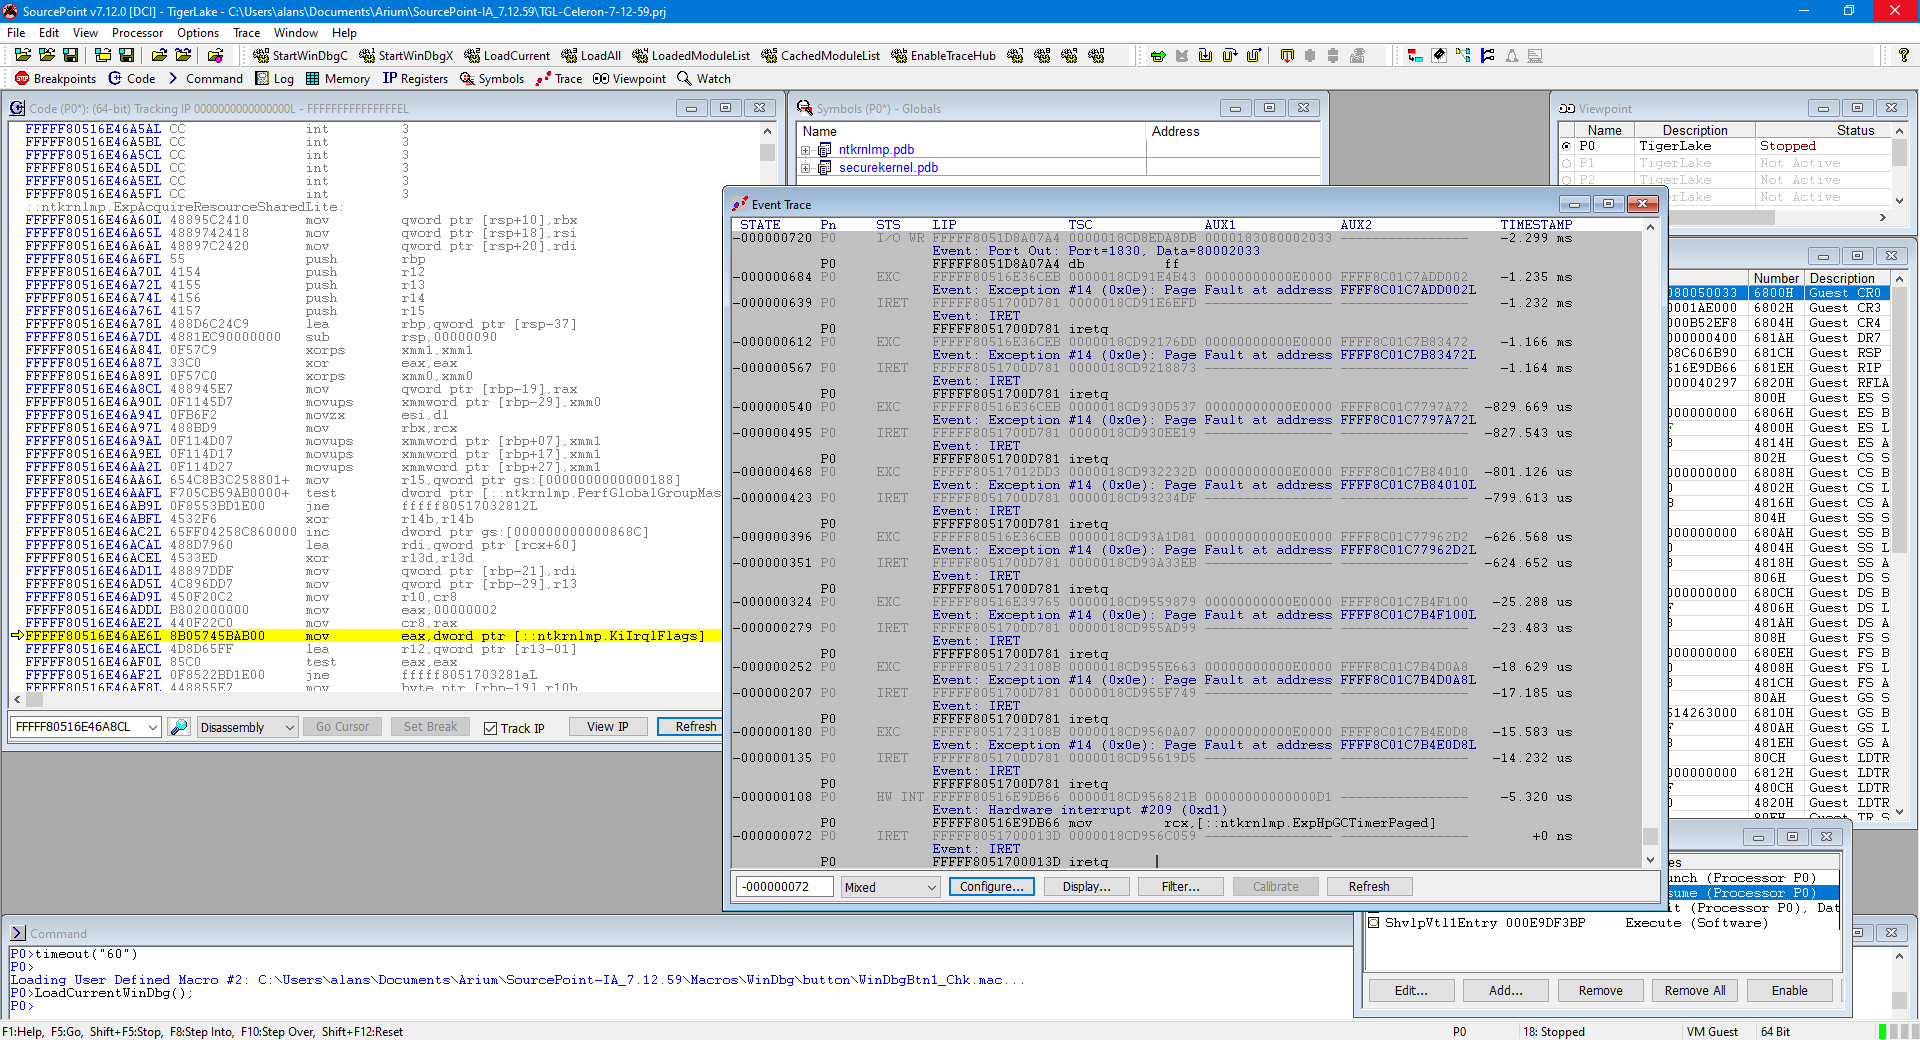
A closer look at the AET trace shows this:
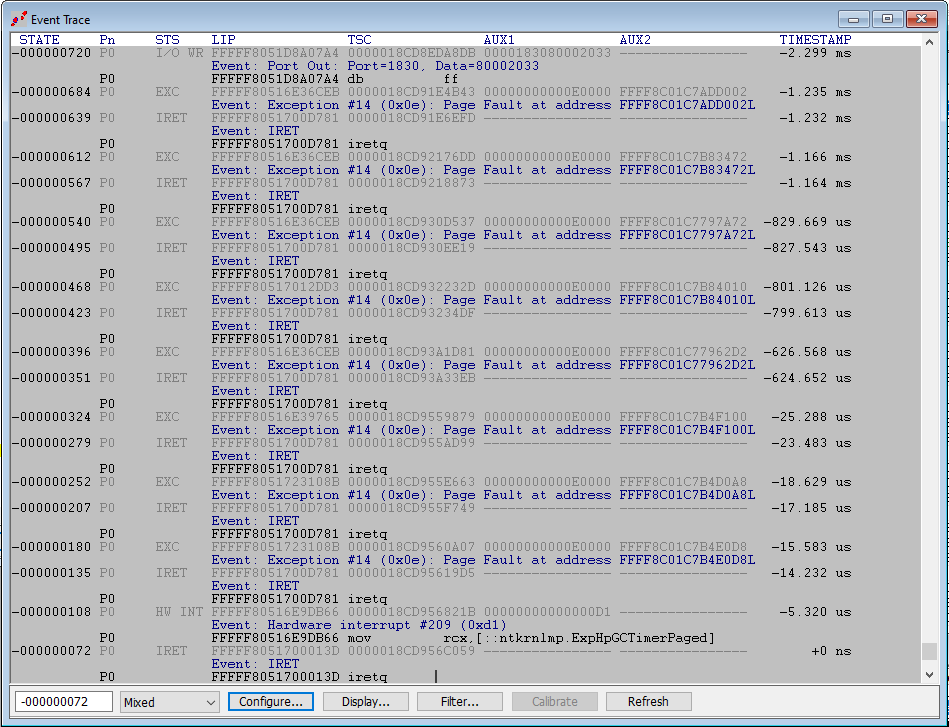
Note that all of the events (with the exception of the Exceptions) are associated with three lines: the packet itself, the event label, and the disassembled instruction. We’re in Guest mode here, so we can see everything. Note that the LIPs (linear IP) in the packets are in the FFFFF8051XXXXXX range.
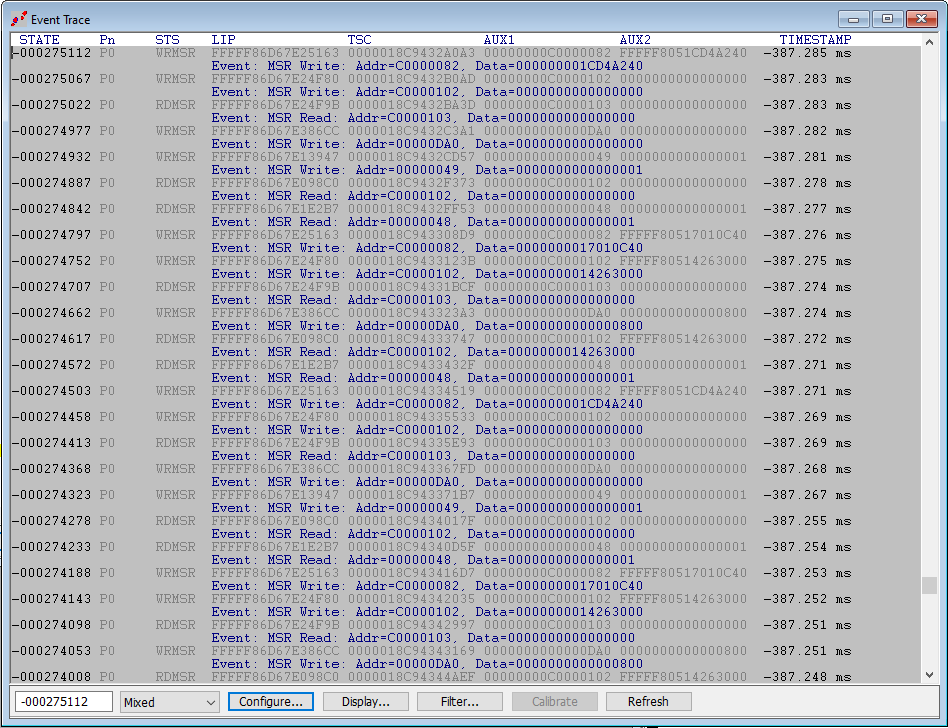
Scroll up in the trace, however, to when we are in Host mode, where RDMSRs and WRMSRs are happening, and you see that none of the actual instructions are visible, just the events captured. The LIPs are in the FFFFF86DXXXXXX range:
There’s lots more to discover and learn, but that’s probably enough for now. I like writing shorter blogs, unlike Connor McGarr. 🙂
Stay tuned, we’ll look at LBR trace coupled with AET to get some further insight into the origins of these events. Then combine AET + LBR + Intel PT for the deepest insight into Windows’ operations.