
In my last article, I illustrated the use of the BCD element, enablejtagbreak, to explore the very earliest stages of the Windows boot process. And it was in early boot that the CrowdStrike CSAgent kernel driver did its out-of-bounds memory read; so in this edition, I take a detailed look at code execution and architectural event trace in the boot flow, as a preface to using these trace features to triage similar driver issues.
To recap from last week’s blog, Andrea Allievi and the Microsoft team created a BCD element named enablejtagbreak, which allows JTAG-based debuggers to break at a deterministic point in the early Windows boot. We then followed the sequence:
- We break in winload_prod.BlBdWaitForJtagHwDebugger, in a deadloop. We’re in 64-bit mode.
- We use JTAG to break out of the deadloop, and then use a VM Launch breakpoint to break at hvix64. We’re in VM Guest mode.
- We hit Go, and hit at a 2nd VM Launch breakpoint to break in hvloader. We’re in VM Guest mode again, but this time at what seems to be a User land address.
- We hit Go again, and enter another deadloop in securekernel.SkInfiniteLoop. We’re in Guest mode, in VTL 0.
- We escape the deadloop again, and hit Go, this time to hit the 3rd VM Launch breakpoint, this time at securekernel.ShvlpVtl1Entry. We’re in Guest mode, in VTL 1.
This is quite a journey. Seeing the code and transitions in action has taught me more in the last few weeks than reading the Windows Internals books for the last year. There’s really nothing like being hands-on.
But I wanted to learn more. What is happening between these boot stages? What are the functions in the above modules doing? What does the code flow look like? What’s happening under the hood in terms of architectural events on the Intel CPUs? This is where Intel Processor Trace (Intel PT) and Architectural Event Trace (AET) come in. And the CrowdStrike outage motivated me to see how these utilities might be used to triage memory safety issues and other similar bugs, especially as it relates to a BSOD “boot loop” that is not easily escaped. It is important to take into consideration that debugging tools need to work in all Windows environments: with and without Hyper-V enabled, avoiding the mitigations presented by PatchGuard, HVCI, VBS-enabled enclaves, HLAT, etc. etc.
To keep this article fairly brief, I’m going to highlight what I learned about going from Step 1 to Step 2. In other words, to go from 64-bit mode winload to Guest mode hvix64. What happens as we transition to the Windows hypervisor? As it turns out, lots of interesting things.
Using the same approach as described in Part 8, I break in winload_prod.BlbdWaitForJtagHwDebugger, break out of the deadloop, and set a VM Launch breakpoint. But this time, I also set up Intel PT, and set it up for a large buffer size (1GB).
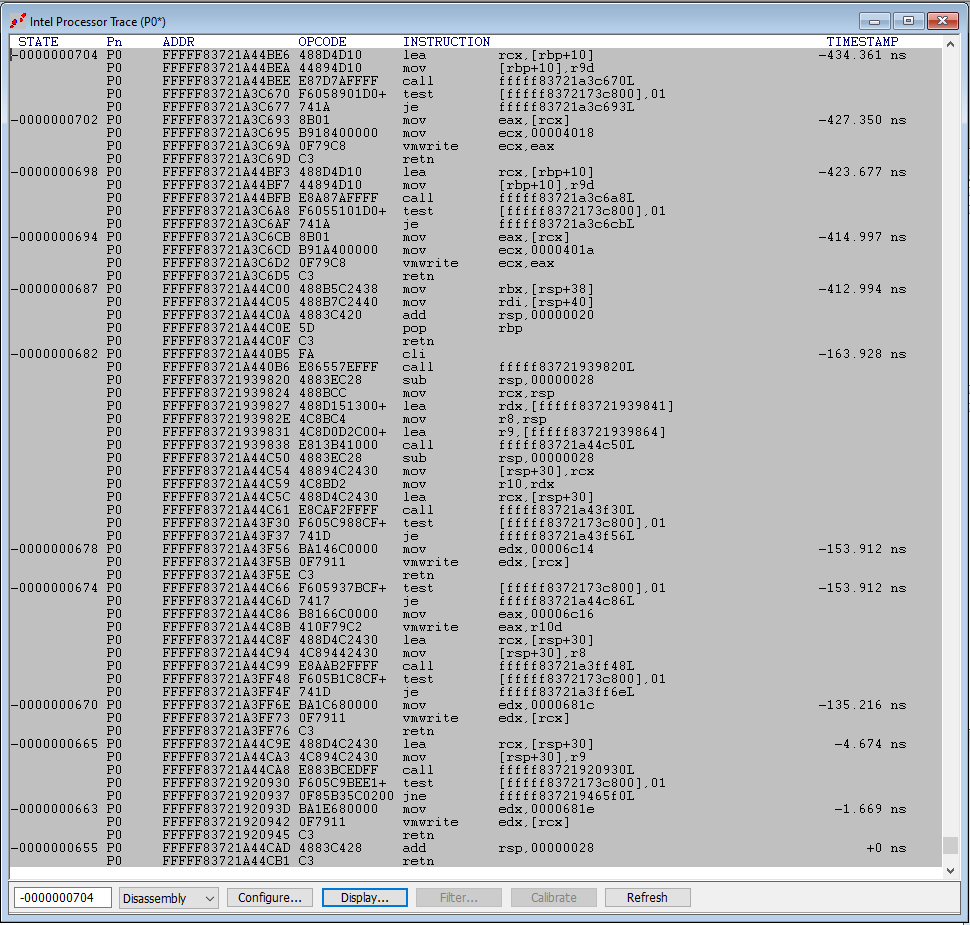
Then hit Go. After about two seconds (1.932 seconds, to be exact), we collect a bunch of execution trace. Let’s look at the bottom, the last instructions executed before hitting the VM Launch breakpoint. Here, we landed in hvix64, and there are no symbols:
At the top, there are the instructions that were executed immediately upon the Go. Note that we have symbols here, of course, since we are still in winload_prod, and we have public symbols available for that module:
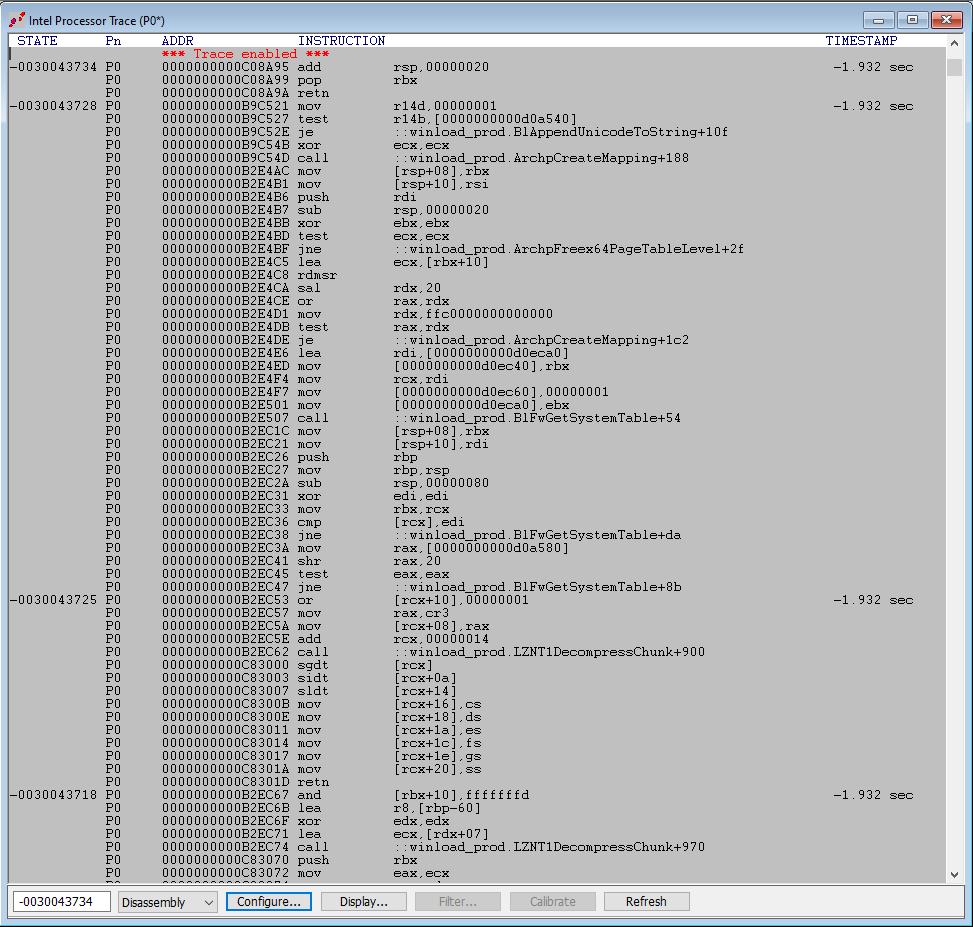
There is some very interesting code that happens upon the transition from winload_prod into the kernel. Below is a small sample:
![]()
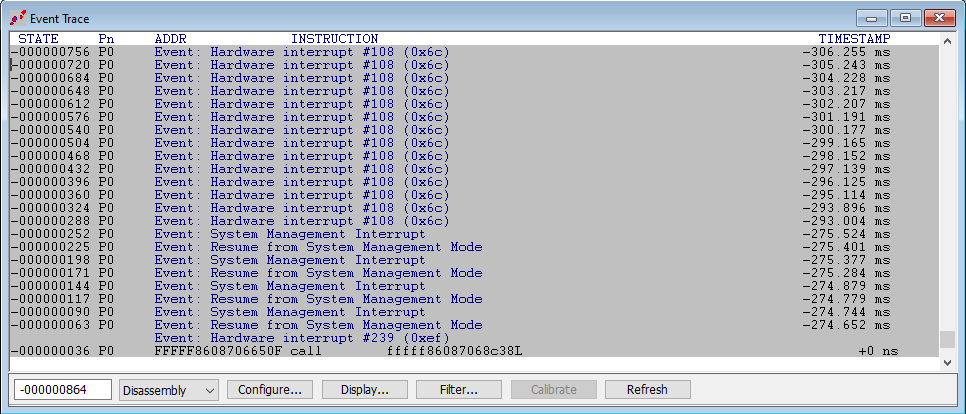
Let’s do the same with AET. We won’t collect all events, just some of interest, because some events occur with such frequency (such as RDMSR/WRMSR, and Port In/Out) that it clogs the DCI connection. What you see below is the last interrupt-related events that happened before hitting the VM Launch breakpoint, that occurs within hvix64:
Well, it’s getting late. There’s so much more to show, but I’ll write about that soon. We could set SMM Entry/Exit breakpoints like we did in the last blog, and correlate these with SMIs and SMM Resumes, both with Intel PT and AET, all with timestamp correlation. That would make an interesting topic. Ultimately, JTAG, when used in conjunction with regular debuggers, is the best technology to handle the extremely low-level interactions that AV software has with Windows and the hardware (trap handlers, transition code, KVA shadow, NMI, MCE and so on…).