
The recent CrowdStrike outage was induced by their kernel driver performing an out-of-bounds memory access, resulting in Blue Screen of Death (BSOD) boot loops on millions of PCs. Such kernel driver flaws are notoriously difficult to debug through conventional means. This article reviews a perhaps unconventional mechanism for debugging such bugs, using some of the functionality inherent in the SourcePoint x86 JTAG-based debugger.
Excellent articles that describe the root cause of the CrowdStrike outage are in Windows Security best practices for integrating and managing security tools by David Weston, Vice President, OS and Enterprise Security at Microsoft; and CrowdStrike’s own Root Cause Analysis (RCA). Excerpts from each of the respective articles clearly explain what went wrong, and what the mitigations are.
First from Microsoft:
“CrowdStrike describes the root cause as a memory safety issue—specifically a read out-of-bounds access violation in the CSagent driver.”
“Unfortunately, with WER data we only receive a compressed version of state and thus we cannot disassemble backwards to see a larger set of instructions prior to the crash, but we can see in the disassembly that there is a check for NULL before performing a read at the address specified in the R8 register.”
“Kernel drivers allow for system wide visibility, and the capability to load in early boot to detect threats like boot kits and root kits which can load before user-mode applications.”
and from CrowdStrike:
“CrowdStrike certifies each new Windows sensor release through the Windows Hardware Quality Labs (WHQL) program, which includes extensive testing through all required tests in Microsoft’s Windows Hardware Lab Kit (HLK) and Windows Hardware Certification Kit (HCK). The WHQL certification process marks the end of a comprehensive internal testing gauntlet involving functional tests, longevity tests, stress tests with fault injection, fuzzing and performance tests. During the testing required for the WHQL program, the sensors use the latest versions of channel files at the time of certification. As new versions of Windows introduce support for performing more of these security functions in user space, CrowdStrike updates its agent to utilize this support. Significant work remains for the Windows ecosystem to support a robust security product that doesn’t rely on a kernel driver for at least some of its functionality. We are committed to working directly with Microsoft on an ongoing basis as Windows continues to add more support for security product needs in userspace.”
Now, I’m speculating here, but I assume that it may take a while before all AV code stops using kernel space to provide at least some of its functionality.
And being of a curious nature, I decided to use our SourcePoint JTAG-based debugger to investigate a failure of this type, and see what I could learn about kernel drivers causing BSODs. Specifically, I explored if some of the functionality that is unique to x86 JTAG-based debugging, such as enhanced breakpoint support, Intel Processor Trace and Architectural Event Trace, might be of use in catching these kinds of bugs before they got out into the field.
For background, I’d recommend looking at my previous related article, JTAG debug of Windows Hyper-V / Secure Kernel with WinDbg and EXDI: Part 9.
So, I decided to simulate the CrowdStrike driver, deploy it on the AAEON UP Xtreme i11 Tiger Lake board, and use Intel DCI with SourcePoint to gain some insight. Here are the steps I took, and what the results were; it was certainly a learning experience, and I haven’t seen this level of detail anywhere else.
Firstly, I created a simple kernel driver that did a read on nullptr. The source code is as below. The “a1 = *pi” contains the dereferencing operator *, and a NULL pointer points to memory that doesn’t exist:
#include <ntddk.h>

void SampleUnload(_In_ PDRIVER_OBJECT DriverObject) {
     UNREFERENCED_PARAMETER(DriverObject);
}
extern "C"
NTSTATUS
DriverEntry(_In_ PDRIVER_OBJECT DriverObject, _In_ PUNICODE_STRING RegistryPath) {
     UNREFERENCED_PARAMETER(RegistryPath);
     int a1;
     int* pi;
     pi = NULL;
     a1 = *pi;
     DriverObject->DriverUnload = SampleUnload;
     return STATUS_SUCCESS;
}
Pavel Yosifovich’s book, Windows Kernel Programming, is an excellent resource for creating a simple driver like this – it doesn’t really require a lot of skill. I’ll outline the individual steps below, and some gotchas I encountered when I built it.
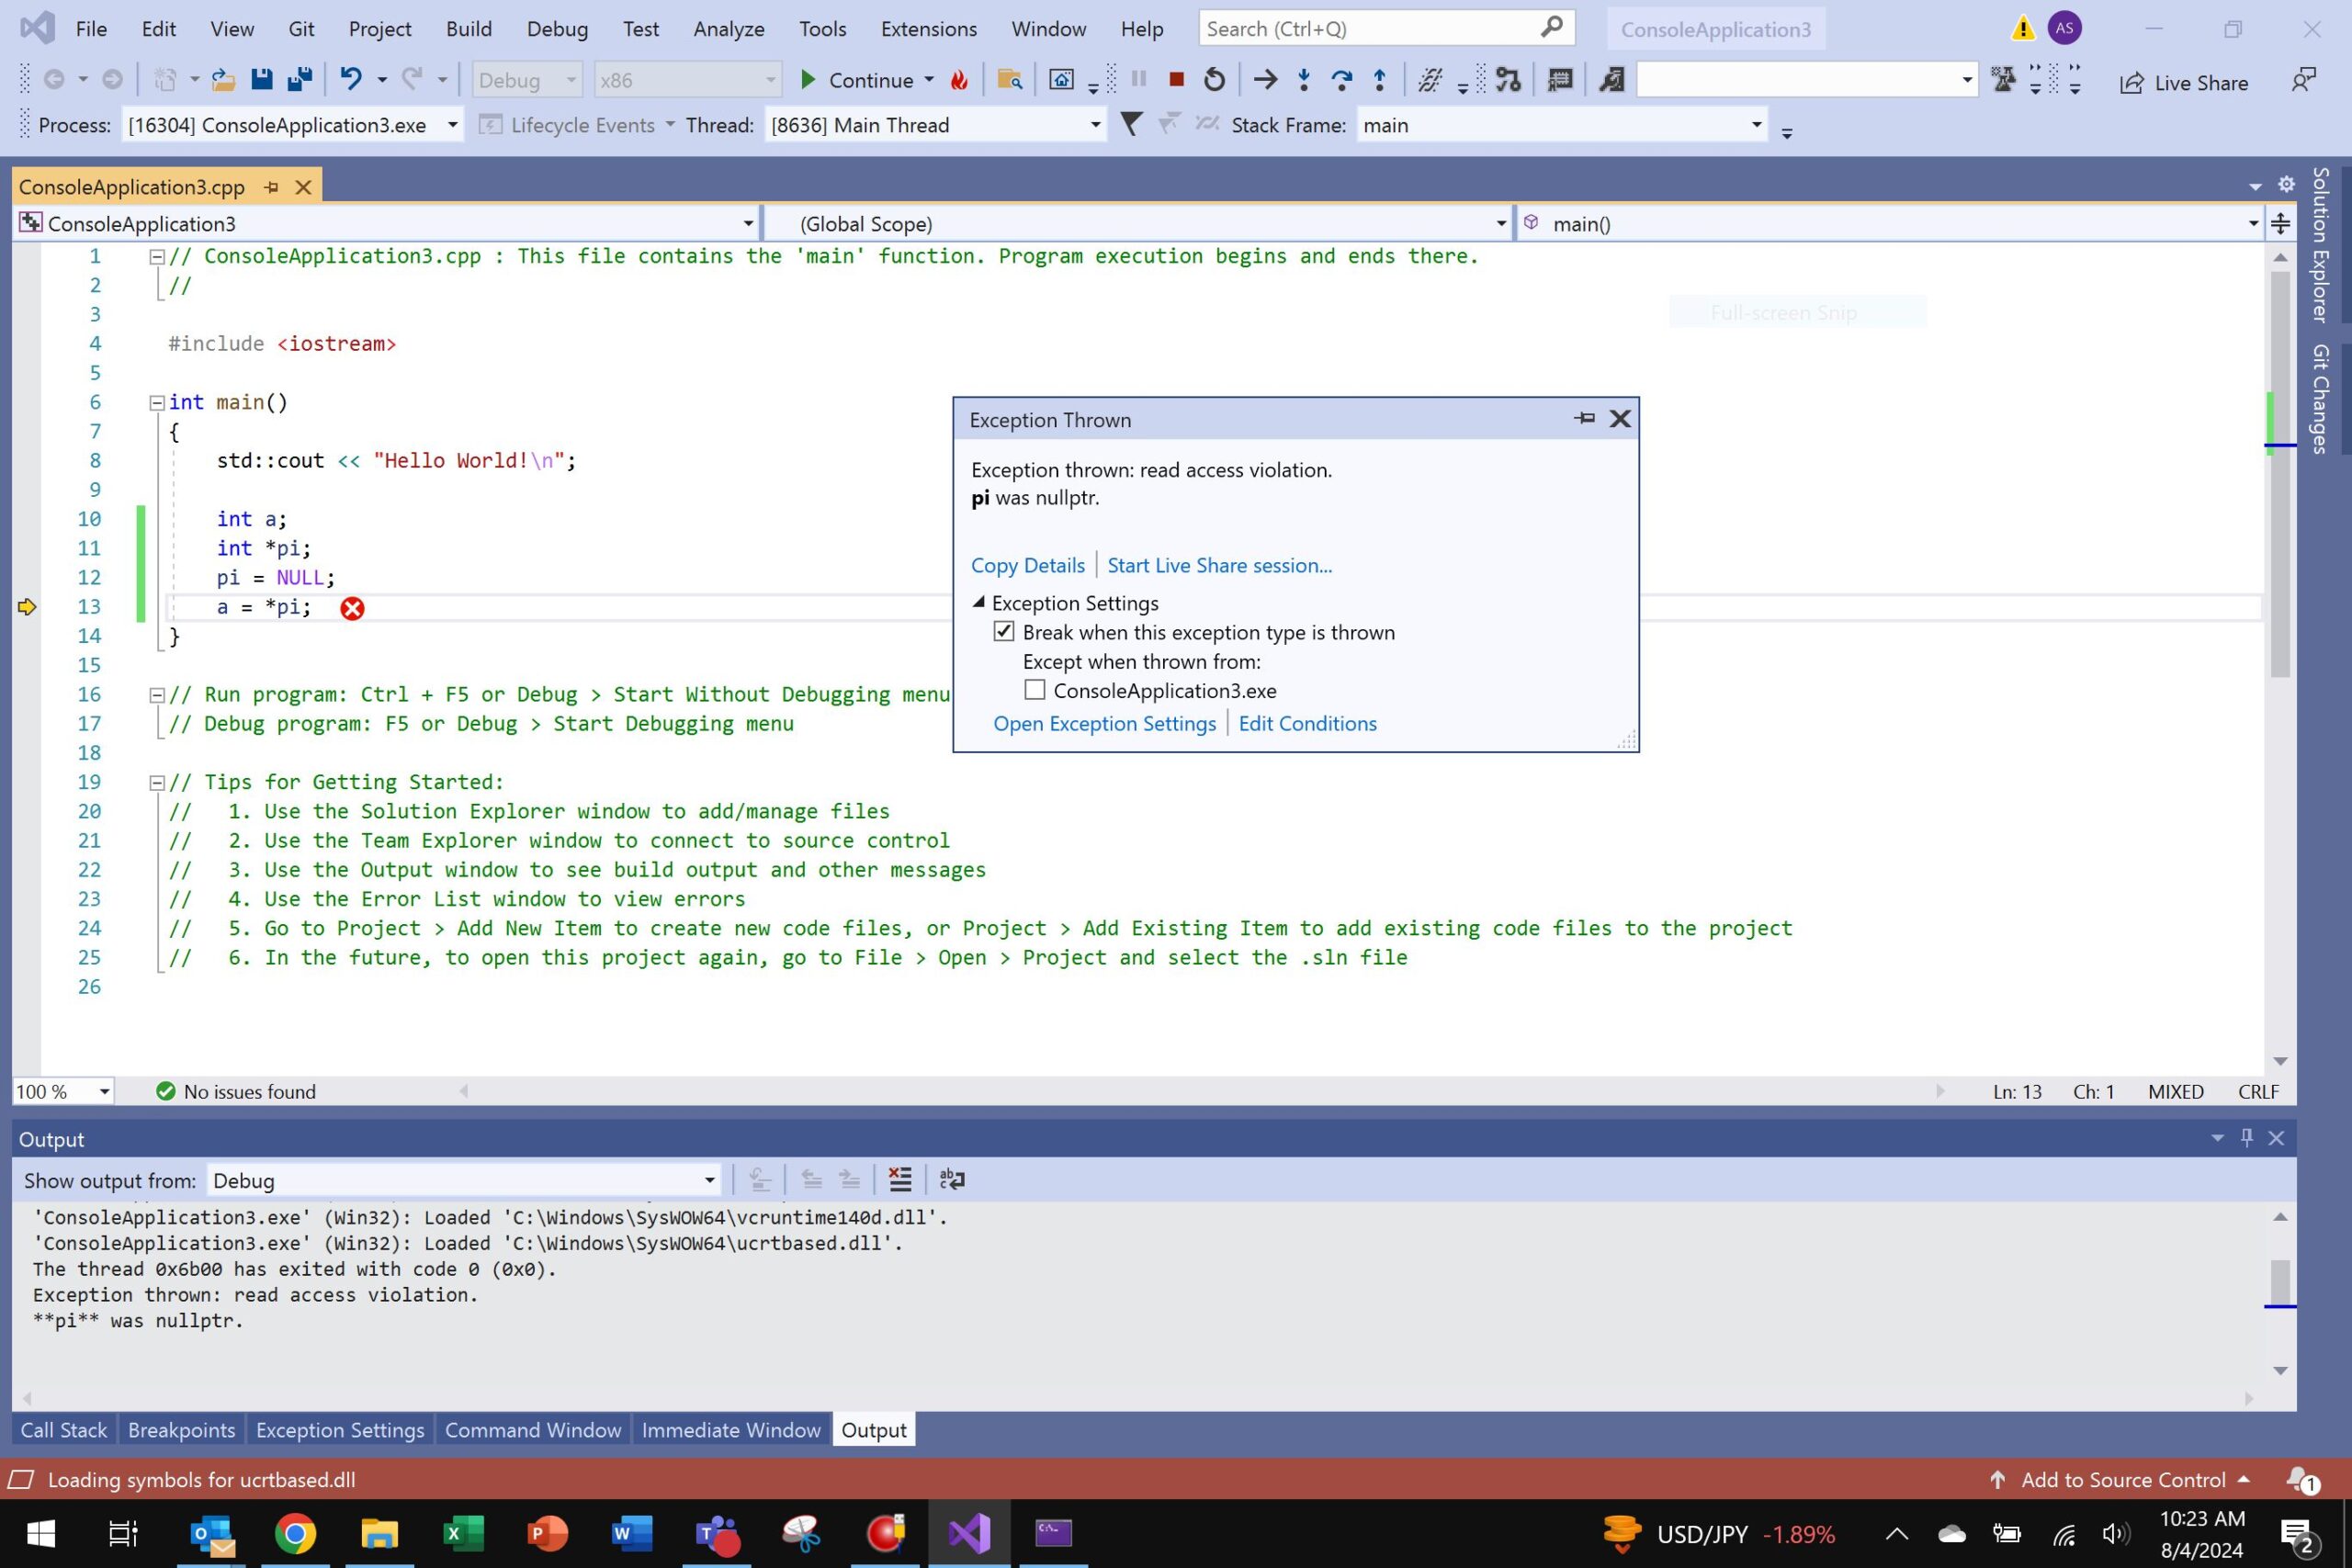
I created a simple console application that implements the above, to test my theory. It correctly throws the expected exception:
Now, to build the equivalent kernel driver takes some extra steps.
Use Visual Studio 2019 with the latest updates. Ensure that the Debugging Tools for Windows is installed, and the Windows Driver Kit (WDK). You’ll know if everything is installed correctly when you launch VS2019, create a new Project, and the “Empty WDM Driver” is available as an option (you may have to search for it):
![]()
Add a source file by right-clicking the “Source Files” folder in Solution Explorer and select “Add > New Item…” from the context menu:
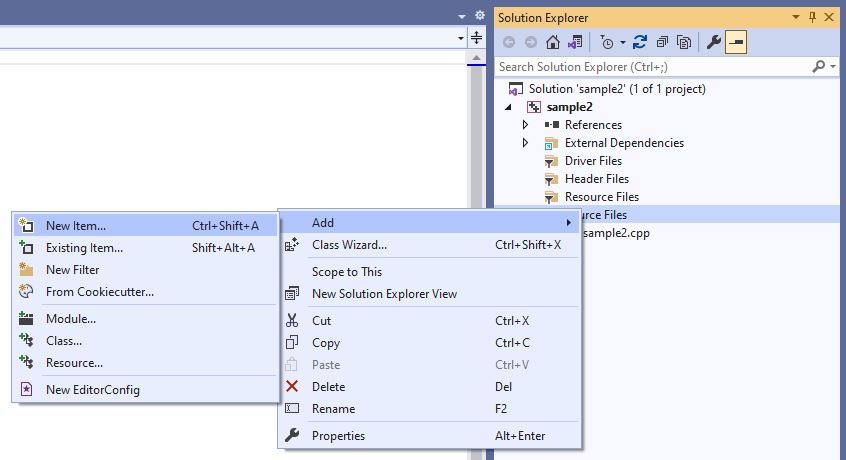
Select a C++ source file, and then copy and paste my driver code above into it.
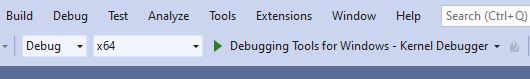
One very important thing that is not mentioned in Pavel’s book: to get this to work, you should set the compile context to “Debug” and “x64” per the below, or you will get an error when you try to load the driver. Experienced driver developers will of course know this, but I didn’t:
Go ahead and compile it, and copy the driver .sys and .pdb files to a known place on the target, for example c:\dev.
Now, on the target, you need to be able to install the driver, and load it. Unsigned drivers are not allowed (you’ll also want to disable Secure Boot on the Tiger Lake board if you turned it on, but it is off by default), so you need to turn on testsigning from a CMD window with Administrator privileges, and reboot the target afterwards:
bcdedit /set testsigning on
Now install the driver (mine was called sample2):
sc create sample2 type= kernel binPath= c:dev\sample2.sys
To load and run the driver, you’ll use:
sc start sample2
Now the fun begins. I wanted to use the SourcePoint debugger to teach me the symptoms of a read of an invalid memory address read, at the Intel CPU architectural level. With this information, I could easily replicate the problem, and determine the most reliable way to debug it. It was pretty clear to me that an Exception would be thrown when the nullptr read was hit. But what kind of an exception? That would take some exploration.
I first thought that a General Protection Fault (#GP) would be thrown. But maybe it was something else? From the Intel Software Developers Manual (SDM), there are a lot of choices:
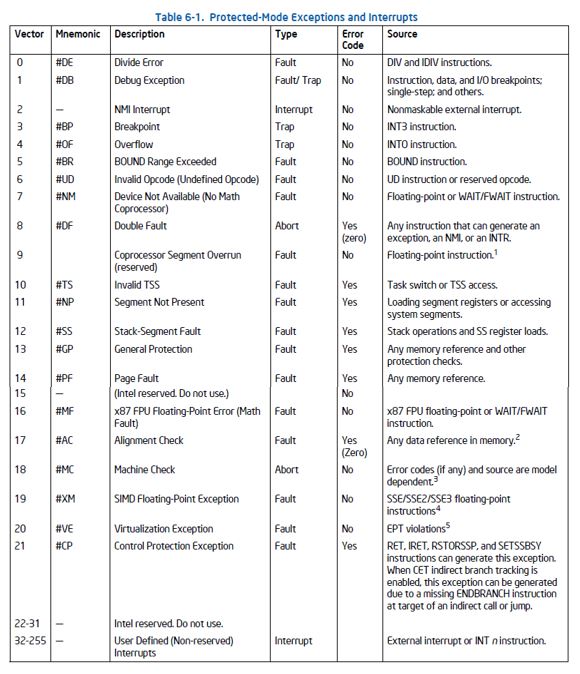
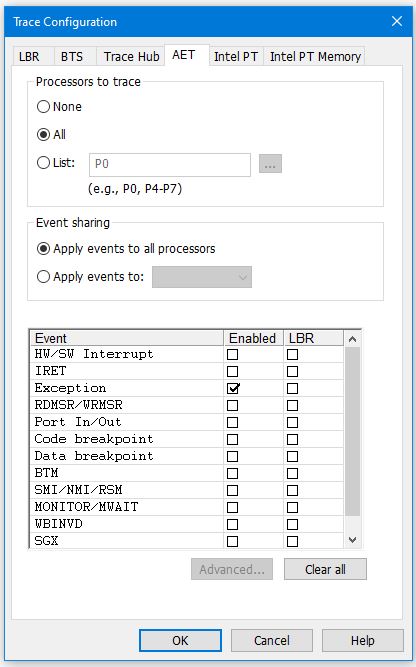
The beauty of SourcePoint is that we can use Architectural Event Trace (AET) to capture all of these exceptions and interrupts. And AET can only be activated via JTAG. Event Trace is wonderful because it doesn’t halt the target. So you could run the target for seconds, minutes, hours, days, etc. and just wait and wait until the event is encountered, and capture the associated breadcrumbs. More on this below.
But in addition to capturing an event and its associated context, we also need to be able to break on the Exception event itself. I’m going to pretend that we don’t have source code or symbols for the kernel driver for this example (of course, if you’re CrowdStrike, you have source and symbols for your driver(s)). This necessitates a side-trip into Events, Interrupts, and the Interrupt Descriptor Table (IDT). SourcePoint has a Descriptors Table window that is used to examine and modify descriptor table entries. You can see the Global Descriptor Table (GDT), Interrupt Descriptor Table (IDT), Local Descriptor Table (LDT), and Local Descriptor Table Register (LDTR). The IDT window looks like this:
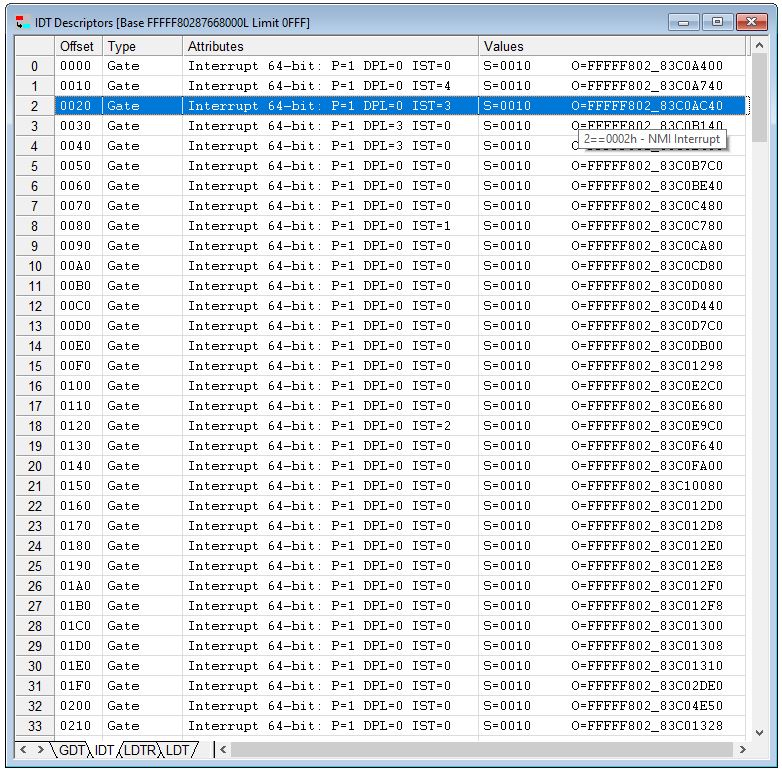
Note the tooltip that pops up that highlights that at Offset 20 from the IDT Descriptor Base (FFFFF80287668000) is the gate for the Non-Maskable Interrupt (NMI). You can compare the two tables above to see how each Exception maps to its Offset – the address the base of its exception/interrupt handler code. If you’d like to learn more about the IDT, I highly recommend, in addition to reading the Intel SDM, the article by Code Machine: Interrupt Dispatching Internals.
By right-clicking an individual Gate, you can view the Properties of the Descriptor, and look at what is in memory there. Opening up a Code window at Offset 14 (x’E0) from the Base, which is the Page Fault exception, shows:
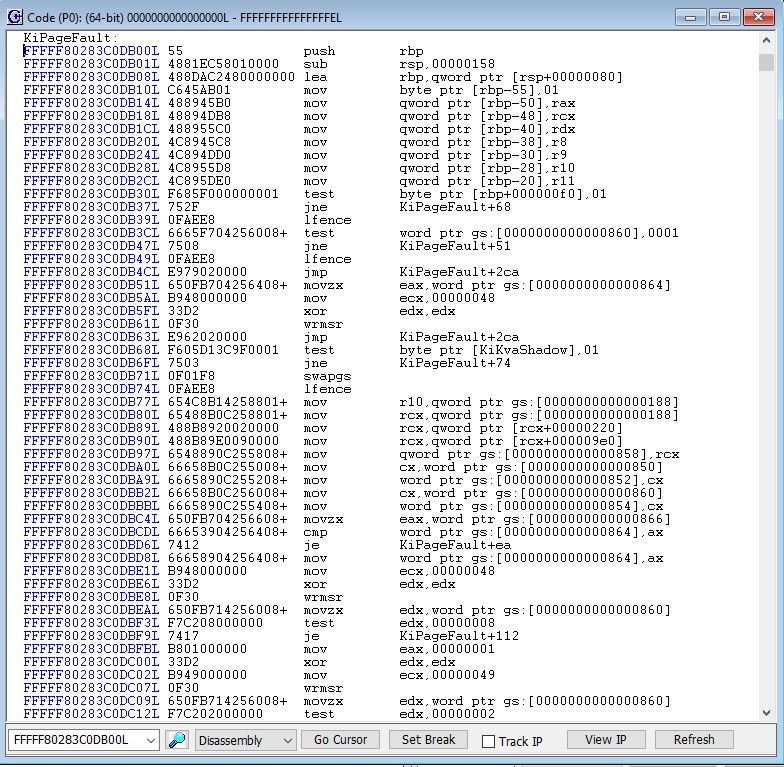
Some of the Exception handlers have symbols, and some do not.
It’s interesting to see the instruction accessing KiKvaShadow (referencing the Windows Kernel Virtual Address Shadow feature).
Now, let’s return to our debugging. Since I didn’t know beforehand what Exception would be invoked when my driver tried to read invalid memory, I turned on AET to capture all such events:
Then I put the target into a Running state, and loaded my driver with the command:
sc start sample2
hitting the SourcePoint Stop button once the BSOD showed up:
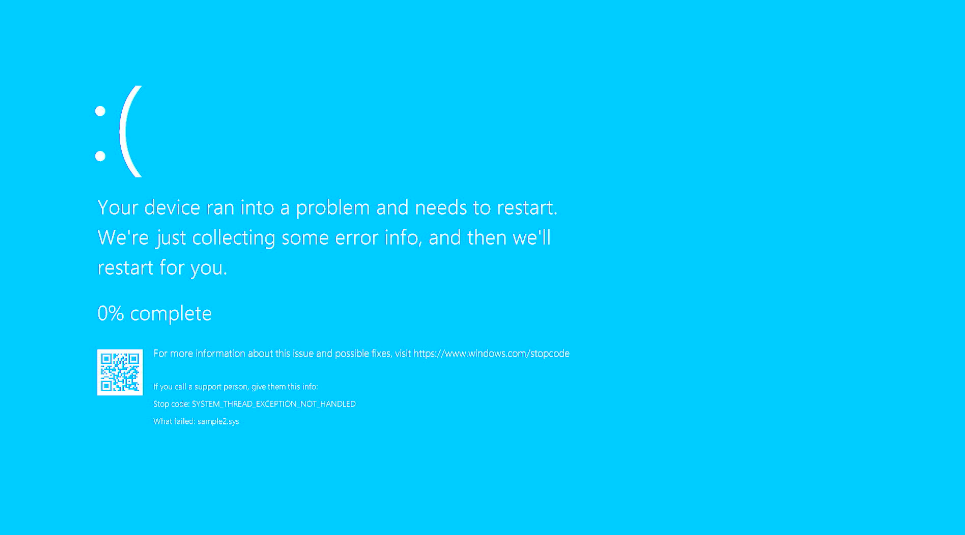
Sidebar: note that the Stop code says SYSTEM_THREAD_EXCEPTION_NOT_HANDLED. I don’t see much from searching the web for this stop code.
Looking at the Event Trace window in SourcePoint is quite enlightening. I’ll just show some of it:
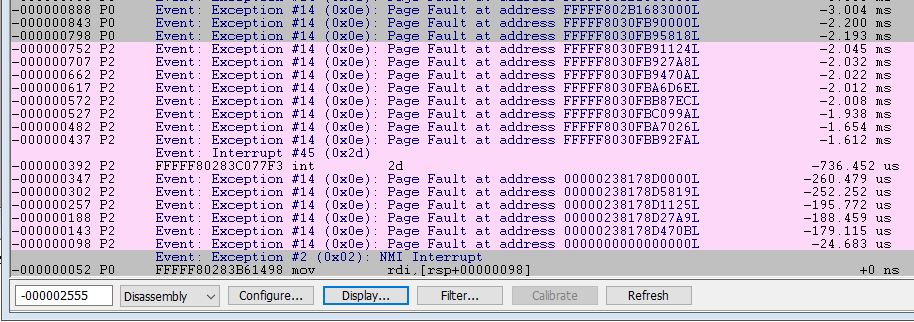
Note that the very last exception is an NMI. And the second last exception is the page fault from my driver’s read of address 0.
It’s also interesting to see the normal page faults always running in the background with Windows, and the scheduler swapping between thread 0 (P0 in SourcePoint terms) and thread 2 (P2).
It occurs to me to mention that these addresses are virtual. So, a read to physical address zero did not happen; the page fault happens, and then the NMI handler is invoked.
Why an NMI? I’m guessing that the page fault handler, when called upon to read virtual address 0, of course fails, and then the NMI is used to knock down all threads on the target, as a Windows protection mechanism.
And what is that Interrupt #45 (0x2d) beforehand? Looking in the IDT, it is designated as a Software Interrupt. And opening the code at the specified address takes us to nt!KiDebugServiceTrap. Interesting.
Now, we’ll take the debugging to the next level. Now that it’s been determined that the NMI handler is invoked as the very last event before Windows goes into recovery mode, let’s turn on Intel Processor Trace and watch the code executed prior to the NMI event. And we’ll keep AET on too, since because the timestamps for both Intel PT and AET can be correlated, we’ll see exactly what the code is doing leading up to the NMI being issued.
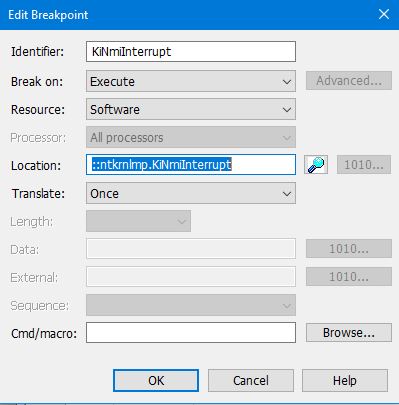
We can see from the IDT window above that the NMI handler address is FFFFF80283C0AC40. This represents the entry point to the function KiNmiInterrupt. Set a breakpoint there:
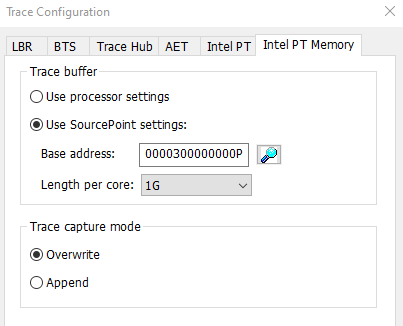
Turn on Intel PT and set aside a good-sized 1GB buffer:
And retrace our steps. This time, we time-align both the instruction trace and execution trace, and set the zero timestamp at the last executed instruction before the NMI breakpoint was hit. Clicking on the NMI Event in the AET window shows us the exact code executed before the interrupt occurred:
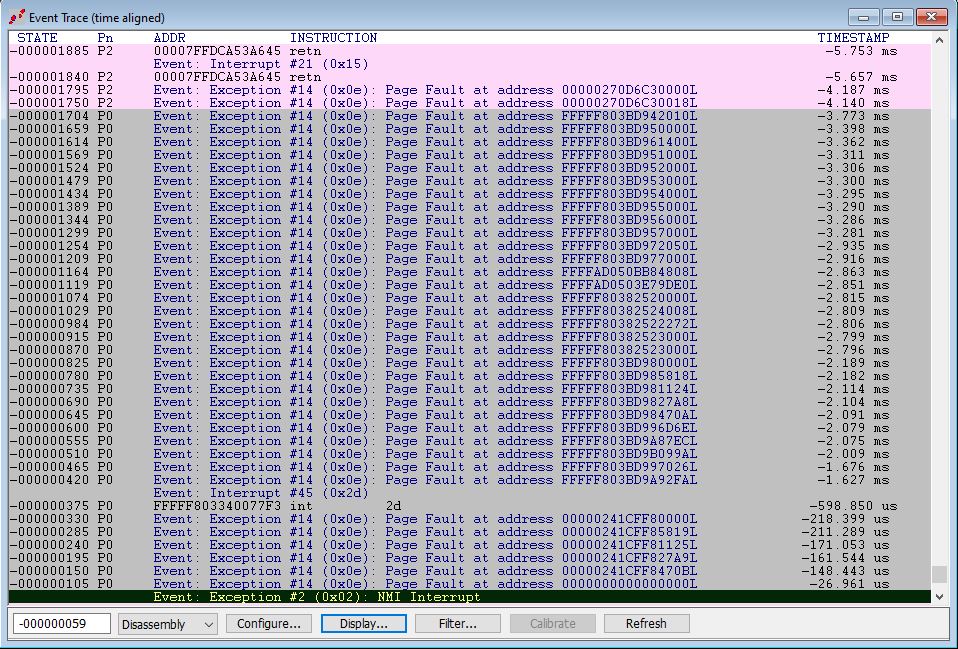
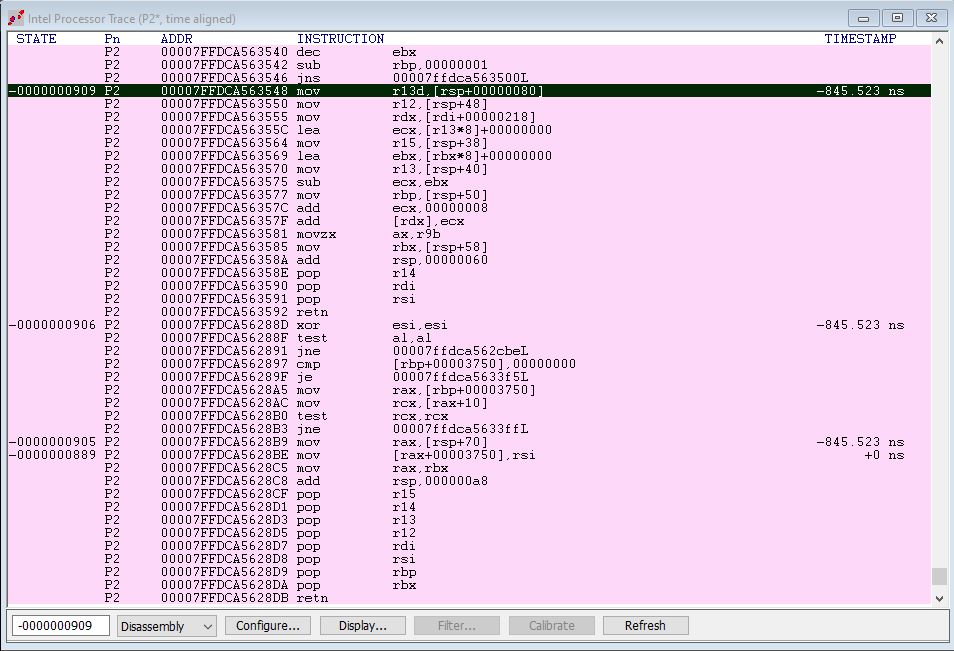
A few interesting things are observable here.
The last code running was on P2, as can be seen in the Intel PT window. P2 was running code in user space at the time the NMI occurred.
The RETN was the last instruction executed prior to the break at KiNmiInterruptStart.
The actual NMI event is correlated with the instruction MOV [RAX+00003750], RSI.
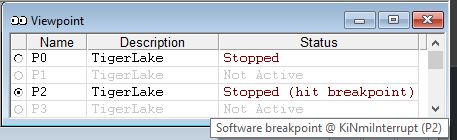
The actual NMI event occurred on P2, as can be seen in the Event Trace window. The event handler breakpoint hit on P2, as you can see in the SourcePoint Viewpoint window, with its tooltip:
If you look at the SourcePoint Code window, you see the code at the entry point to KiNmiInterruptStart, on P2 as indicated in the title bar:
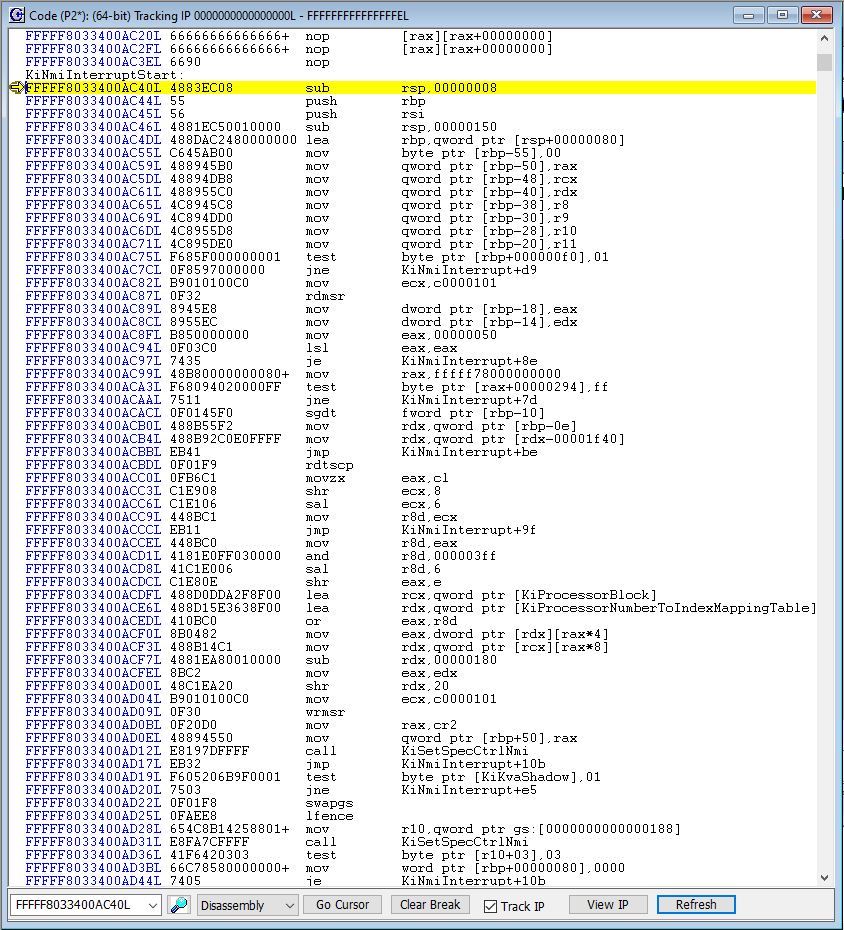
Note that KiKvaShadow shows up again.
My kernel driver code that did the read of virtual memory address 0 was running on P0, as can be seen in the third-last line of the Event Trace window, 26.961 microseconds prior to the actual NMI. Now, it’s a matter of tracing back in time with Intel PT to find the offending code (in this case, I of course happen to know that it was my kernel driver that was at fault). That’s easy to do, as I’ve captured that instruction execution with Intel PT. I’ll show more on how that’s done in my next blog post.