
If you’re reading this blog, you’re probably aware that we’ve enhanced our SourcePoint UEFI debugger with many new features over the last year, targeting hypervisor and Windows kernel debug, with an emphasis on Hyper-V, the Secure Kernel and Virtualization-Based Security (VBS). I thought it might be helpful to list out and describe some of the groundbreaking new capabilities that are not available with any other tool. Also, at the end I’ll briefly cover a disruptive new feature that will be coming out in our upcoming release!
As expressed by Andrea Allievi, Microsoft Windows Core OS Engineer and principal author of the Windows Internals book, 7th Edition, Part 2, and one of our key beta testers, with whom we’ve been working with for many months:
“We’ll use SourcePoint WinDbg when regular debuggers cannot do the job (i.e. for trap handlers, transition code, KVA shadow, NMI, MCE, and so on…)”.
High praise indeed! In fact, much of our product development effort was inspired by his 2023 article, Debugging the undebuggable – Part 1, in which he described the use of the EXDI protocol in conjunction with QEMU and GDB to delve into unexplored realms within Windows.
But, specifically what features makes SourcePoint WinDbg unique, and so powerful? I’ll list some of them here, and explain.
The short list is:
#1: Intel Processor Trace
#2: Architectural Event Trace (AET)
#3: VMX breakpoints
#4: VMCS Visual Viewer/Editor
#5: Reading Host mode memory from Guest mode
#6: WinDbg JTAG integration with SourcePoint using EXDI
#7: WinDbg/kdnet native integration with SourcePoint
The first two have been in existence for UEFI debugging for many years, and were enhanced to work more effectively in a Windows environment. The last five are unique new features that apply primarily to Windows, Linux, and hypervisor/RTOS environments.
#1: Intel Processor Trace
Intel Processor Trace, or Intel PT, is logic designed in modern Intel CPUs that allows for instruction tracing. Execution trace packets are highly compressed and streamed to system memory, with very nominal timing performance impact – it allows the target to run at-speed and collect instruction trace without slowing down the system. Within the SourcePoint environment, Intel PT is set up with a given size system memory buffer (4kB up to 2GB is typical), and when the target is halted, instruction trace is uploaded over JTAG to the host PC debugger. The article WinDbg with Intel Processor Trace covers this technology in detail. A few screenshots covering the configuration and typical results of Intel PT should be self-descriptive:
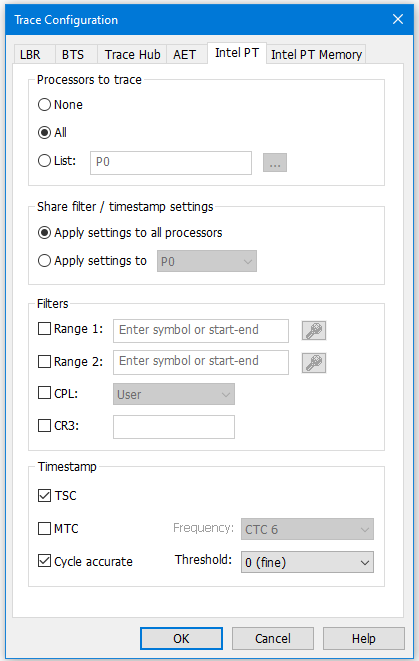
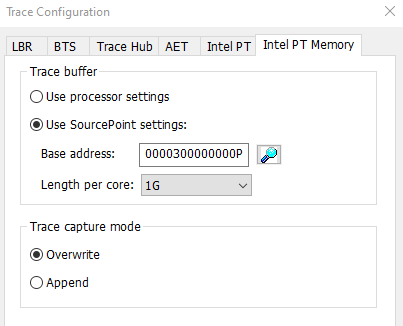
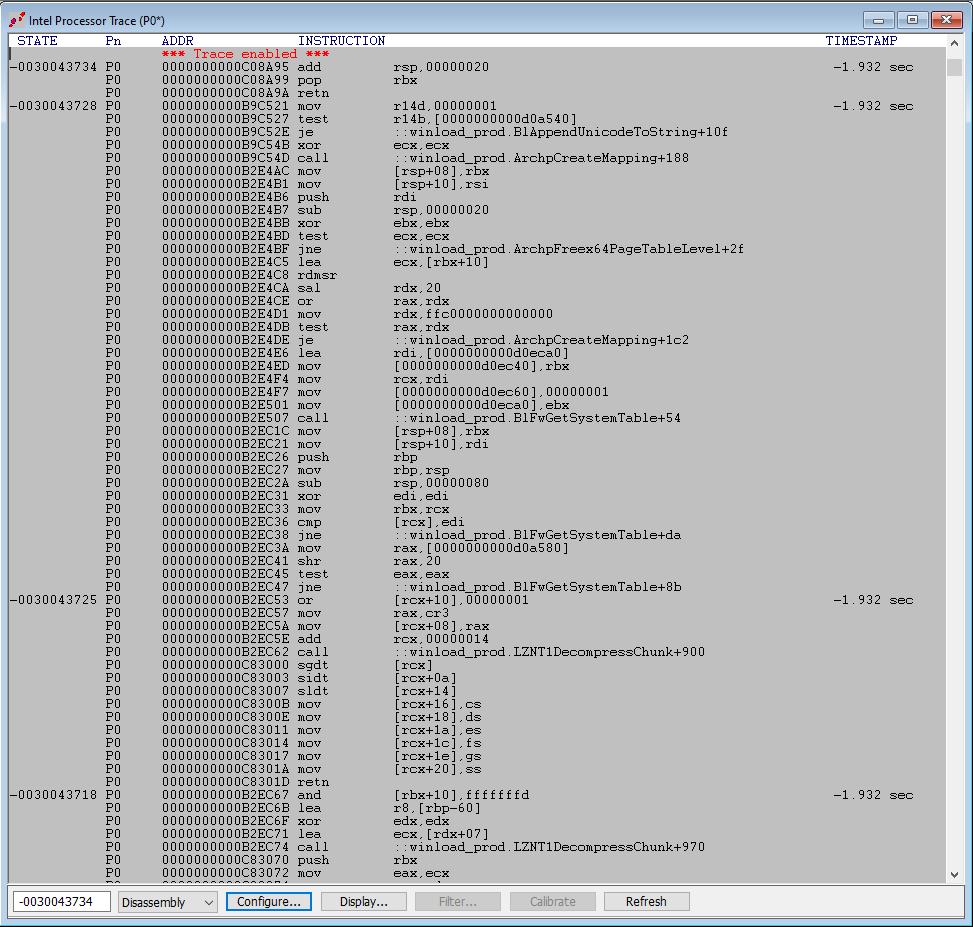
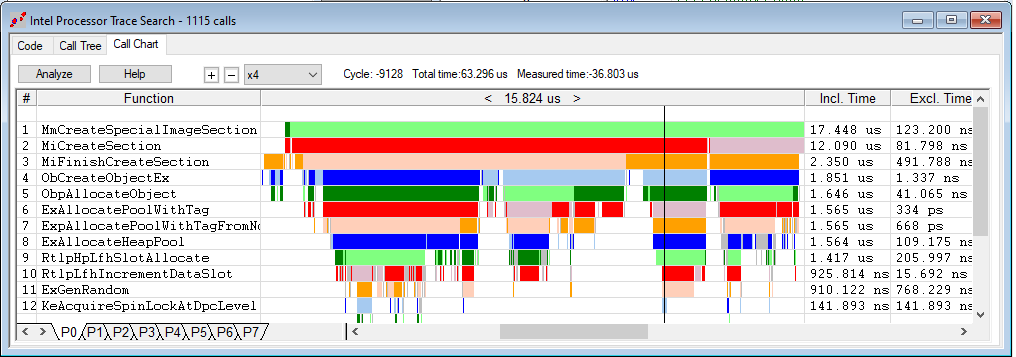
Scrutinizing these images closely, you can see how powerful the SourcePoint implementation of Intel PT is. Not only are all executed instructions captured and displayed, but a Call Chart can also be used to visually and colorfully display the call flow and where the Windows code is spending its time. There are several ways to view the code flow to analyze Windows’ performance; the technology behind these performance analysis tools is very complex.
It is worthwhile noting that Hyper-V-enabled Windows has mitigations in place to turn off Intel PT at various places within the code. This is accomplished via what are called “conceal bits” and documented within the Intel Software Developers Manual (SDM):
Since SourcePoint uses JTAG, it is able to detect the setting of these VMX control conceal bits “under the hood”, and clears them, enabling Intel PT to be run at all places in the Windows code.
To my knowledge, there doesn’t appear to be any other tool on the market, either open-source or commercially available, that has this rich functionality specifically targeted for Windows.
#2: Architectural Event Trace (AET)
AET can only be enabled via JTAG, and SourcePoint is the only generally available tool that supports it without requiring an NDA with Intel.
AET is low-level, architectural event trace. It is implemented via silicon logic within Intel CPUs that uses the Intel Trace Hub and microarchitecturally modifies the behavior of event trace capture.
Event trace information can be captured to the Master Storage Controller Trace Buffer (MTB), a small (typically 8kB) buffer within the CPU that can capture trace directly from system reset; streaming via Intel Direct Connect Interface (DCI) also from reset; and via system memory. If you are debugging early UEFI, such as SEC or PEI, streaming via DCI is most useful. Since Windows requires system memory to be available, streaming AET data to system memory is most expedient.
One of the best information sources on AET is in the webinar I did with the UEFI Forum, the recording for which is here.
Some helpful descriptive images below should help explain how AET is configured and used:
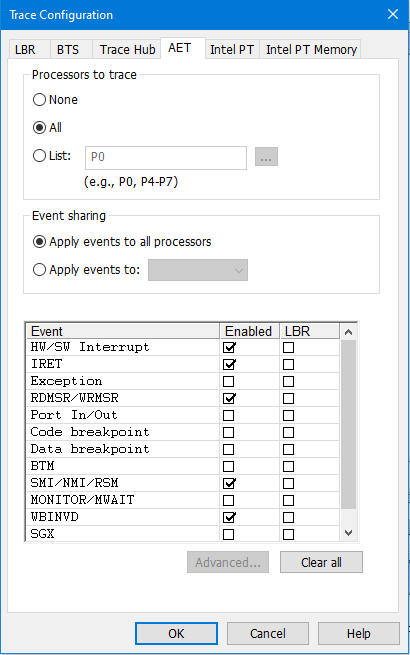
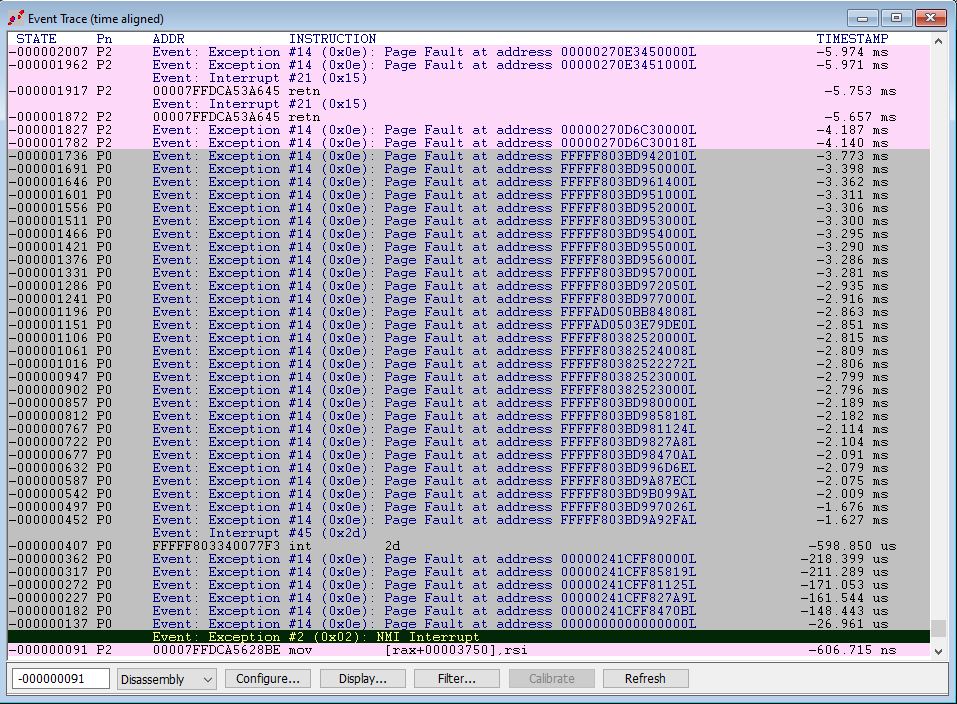
As you can see, event information that can be captured includes that from HW/SW Interrupts, IRETs, Exceptions, RDMSR/WRMSR, Port In/Out’s, BTMs, NMI/SMI/RSM, MONITOR/MWAIT, WBINVD, and even SGX events. All of these are captured in real-time, without interrupting program flow and with no impact on system performance. Amazing stuff.
It should be noted that, as an advanced debugging feature, Intel PT and AET instruction trace and event trace can be used in parallel. For example, if you are using breakpoints and Intel PT to analyze a particular area of suspect code (like a game cheat) and you know that this rogue code is going to read or write an MSR invalidly, you can see the specific RDMSR or WRMSR in the Event Trace window without looking for a needle in a haystack. Ivan Rouzanov demonstrated this functionality at our joint Workshop at REcon this year.
#3: VMX Breakpoints
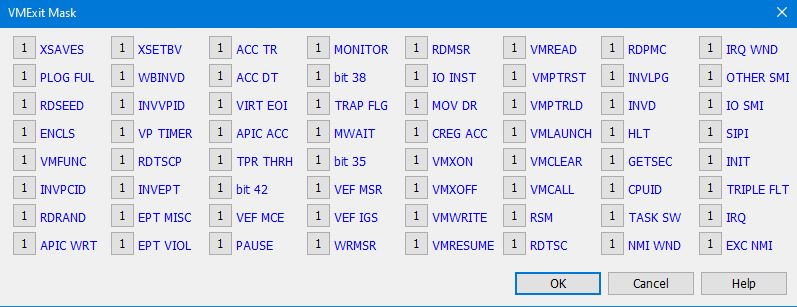
To fully debug a hypervisor, it is important to be able to halt a target undergoing state transitions; for example, from Guest mode to Host mode, and vice versa. As such, SourcePoint provides support for VM Launch, VM Resume and VM Exit breakpoints.
Below are all of the breakpoint types supported by SourcePoint:
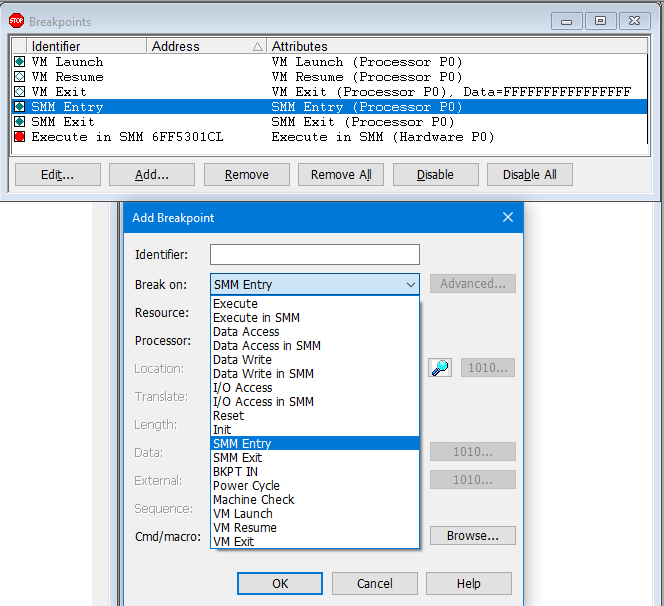
And the VM Exit breakpoint, as an example, is accompanied by an annotated Basic Exit Reason mask (i.e. where one or any number/combination of Basic Exit Reasons can initiate a halt of the target) that are annotated below. See the Appendix C, Table C-1, Basic Exit Reasons, of the Intel SDM for these mask bitfield definitions (note that there are actually more than 64 exit reasons available):
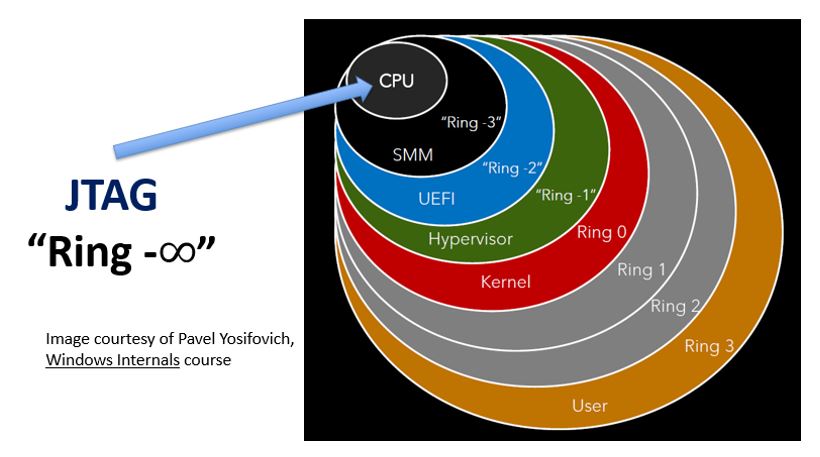
This capability is unique to JTAG. Certainly, it is not possible to place a breakpoint in Host mode memory while the target might be in Guest mode with a normal agent-based debugger like WinDbg; this would break the inherent isolation properties of hypervisor environments. But, it is possible to do so with JTAG. This is because JTAG works “from underneath”, at a hardware level talking directly to the CPU logic, as opposed to requiring target- or agent-based software running within Windows or even within the debuggee’s firmware. JTAG places the target into “probe mode” and uses inherent silicon “run-control” features to perform debugging operations. I like to express this by saying that JTAG operates in the “infinity ring” (realizing that many people may quibble about that definition) because it operates below Windows, below the UEFI firmware, and below SMM, at a hardware level:
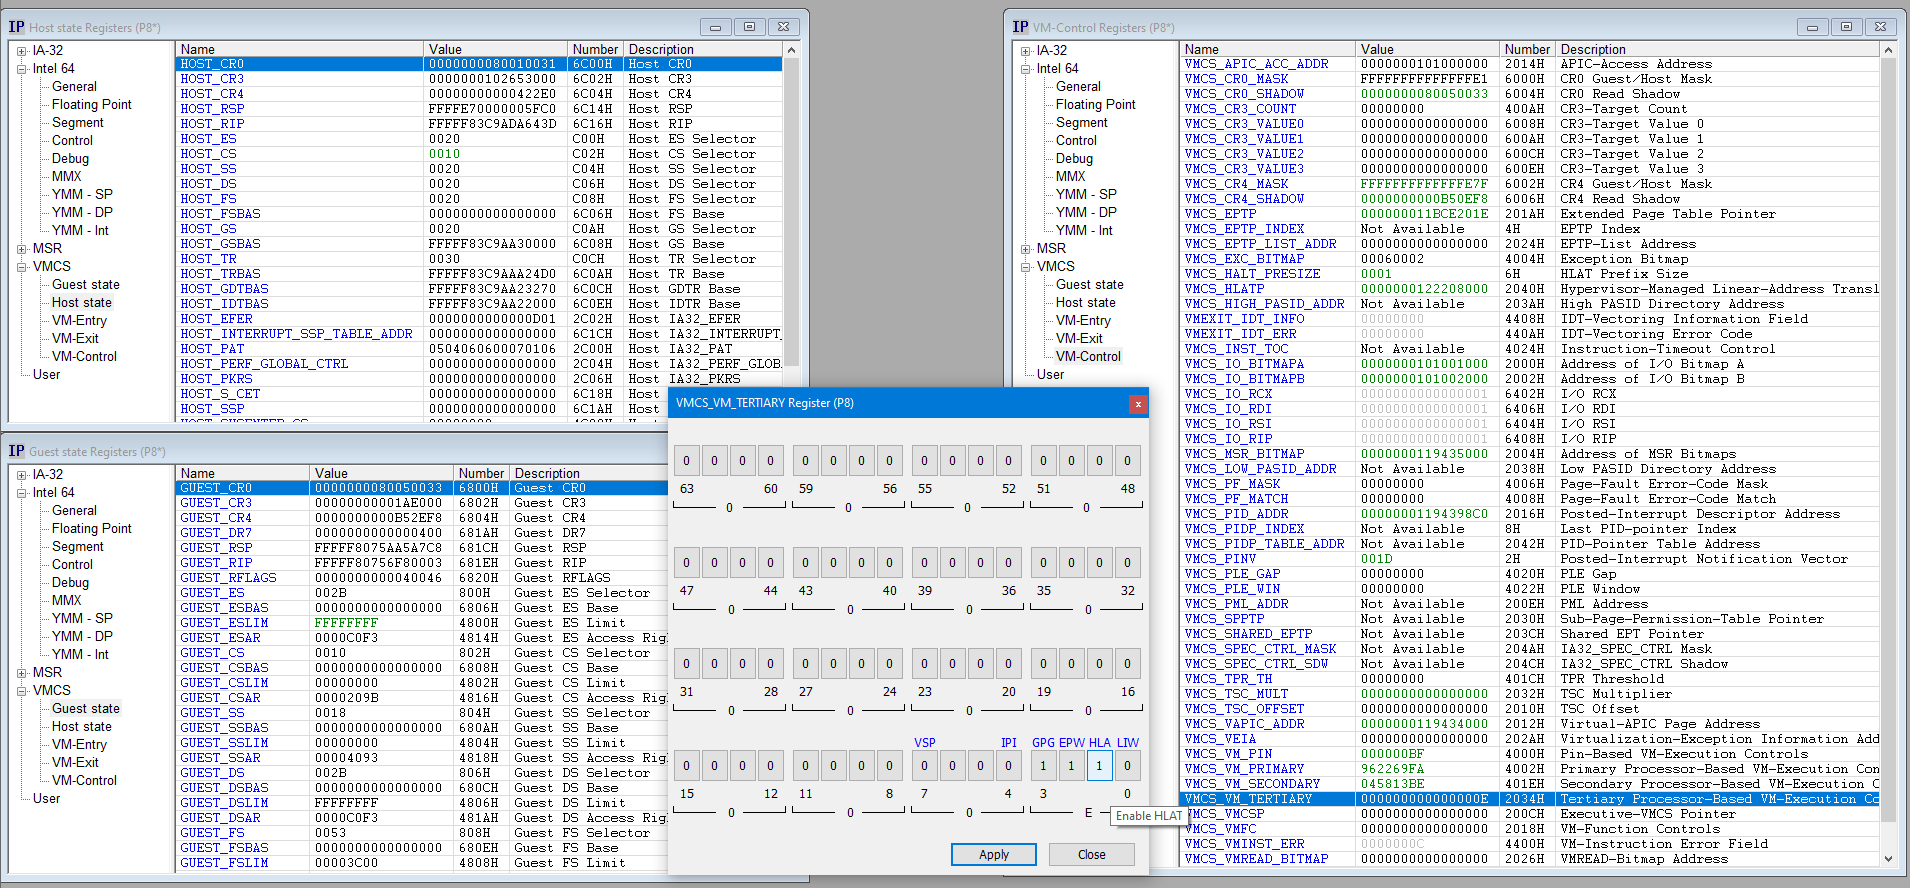
#4: VMCS Visual Viewer/Editor
SourcePoint is unique in being able to visually display and edit all VMCS register fields and controls. With many other tools, both open-source and commercially available, this is accomplished via scripts and command-line debugger extensions. With SourcePoint, in the interested of user-friendliness, the VMCS Viewer/Editor is integrated into our Registers view, and it is possible to view all VMCS registers, do searches, expand a register to see annoted bitfields for a descriptive view of what each element of the VMCS does, and so on.
Here is a sample display where we are viewing the VM Host, VM Guest, and VM Control registers. Also available are views into VM-Entry and VM-Exit controls. Within the VM-Control Register view, it is possible to expand for example the VMCS_VM_TERTIARY register, and see for example the setting of the HLA (HLAT, or Hypervisor-Enforced Linear Address Translation) field:
#5: Reading Host mode memory from Guest mode
This is one of our more amazing features. Everyone knows that one of the main purposes of a hypervisor is to enforce isolation between Guest and Host VMs. So, while in Guest mode, it should be impossible for the Guest to read Host memory, correct? Well, with JTAG, anything is possible. This is especially important when it comes to Intel Processor Trace, and hitting a breakpoint that involves a transition from Host to Guest mode: the target will stop in Guest mode, but we do want to see the Host code execution leading up to the break. Normally, any attempt to do this would absolutely crash the target.
This capability can be clearly demonstrated by following these steps, for example:
- Halt in hvix64 (the Hyper-V hypervisor).
- Set a VM Resume breakpoint.
- Turn on Intel Processor Trace.
- Break in the Secure Kernel via a VM Resume breakpoint or some other mechanism.
You can see that it is possible to record all Intel PT executed instructions by reading Host mode memory from within Guest mode.
By many who have seen this for the first time, it is considered magical. It was demonstrated for the first time at the Montreal 2024 REcon conference.
I should also note that, using the same technology, you can also read Host mode VMCS fields while the target is in Guest mode. Again, this is another “only available with JTAG” feature.
On the same note, it is possible to manually single-step through a VMCALL instruction on the Guest side, and have the instruction pointer update to the Host RIP and land in the hypervisor (hvix64) context.
#6: WinDbg JTAG integration with SourcePoint using EXDI
All of the features described above are unique to the SourcePoint environment. ASSET did realize early on that a great many engineers performing Windows debug use the Microsoft WinDbg debugger, that has a huge following and a great many powerful capabilities. Would it be possible to merge the two tools so that they could be used together, in essence to create a “1 + 1 = 3” scenario? Fortunately, a public API, named EXDI (Extended Debug Interface) provides just such an interface. EXDI is described at length in the Microsoft article here: Configuring the EXDI Debugger Transport, in a 2021 article by Our Windows Man, What EXDi can do for you that DCI can’t, and in fact formed the basis of Andrea Allievi’s Debugging the Undebuggable article referenced above.
With EXDI, the topology between WinDbg, SourcePoint and the debugging target looks like this:
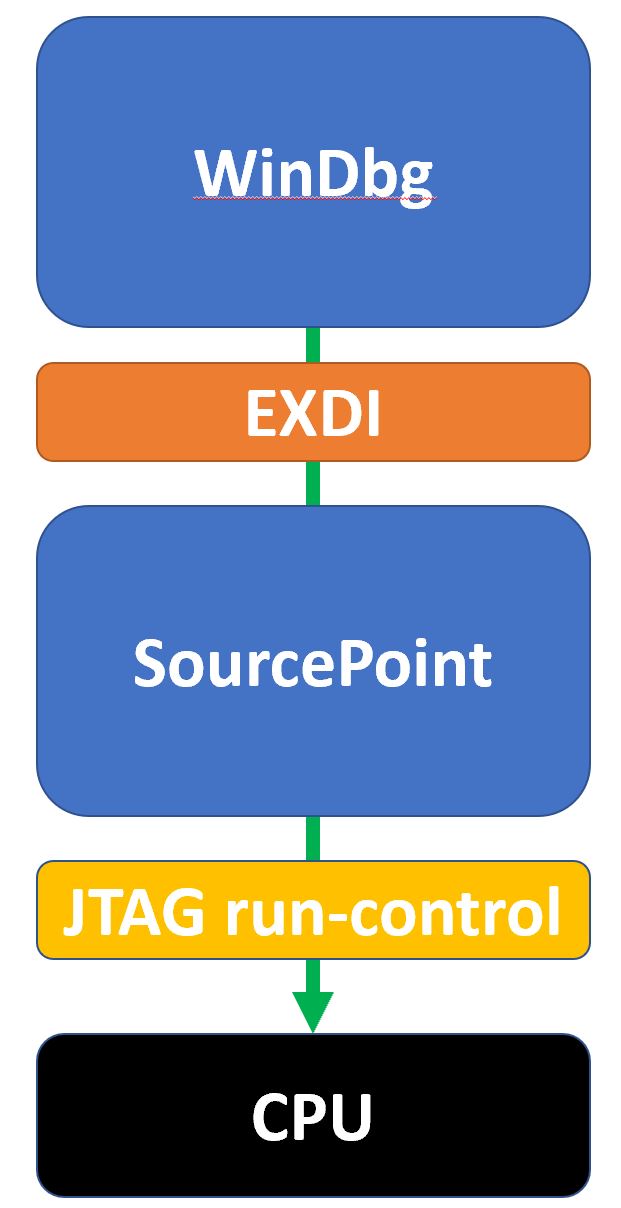
In this topology, WinDbg is the “controller”, and SourcePoint is the “worker”. Debugging commands are issued from WinDbg and sent over the EXDI connection to the SourcePoint JTAG debugger; then SourcePoint performs them directly on the target.
This approach is very synergistic, and allows WinDbg commands, such as setting breakpoints, reading deferred symbols, reading/writing system memory, registers, I/O, etc. to be performed with the power of the WinDbg command set; and under the hood SourcePoint can initiate VMX breakpoints, SMM breakpoints, take advantage of its powerful Intel PT and AET trace features, etc. As long as the two applications don’t conflict, they co-exist and effectively put WinDbg “on steroids”. And in fact, many users will find this combination to meet all of their debugging needs. But for even more advanced users, we are introducing a new capability as described below.
#7: WinDbg native integration with SourcePoint
This capability is being introduced with our October SourcePoint release. Some customers had suggested an even tighter integration with WinDbg than could be accomplished via EXDI. This is because WinDbg over EXDI introduces some restrictions, in particular, quoting from Microsoft’s Configuring the EXDI Debugger Transport article:
EXDI is an advanced, specialized form of debugging for specific environments. Using a standard KDNET connection is easier to configure, and is recommended…Because EXDI does not make use of the KDNET protocol, the connected debugger has significantly less information about what is running on the PC and many commands will work differently or may not work at all.
Although ASSET has mitigated almost all of these EXDI deficiencies, such as providing access to symbols within the SourcePoint environment directly, there are some remaining issues. For example, WinDbg Classic works much better than WinDbgX; WinDbgX does numerous extraneous memory reads, slowing down the interface. EXDI does not communicate process information for particular threads, making it difficult to specify the process context for setting breakpoints in shared code. And the interface introduces latency, slowing down the debugging process.
To address this, ASSET is introducing a mode whereby the user can optionally avoid using EXDI, communicate directly over JTAG with the target, AND co-exist with multiple WinDbg debugger instances for example using kdnet. So instead of using the controller/worker topology, it’s more of a “star” topology, as illustrated below:
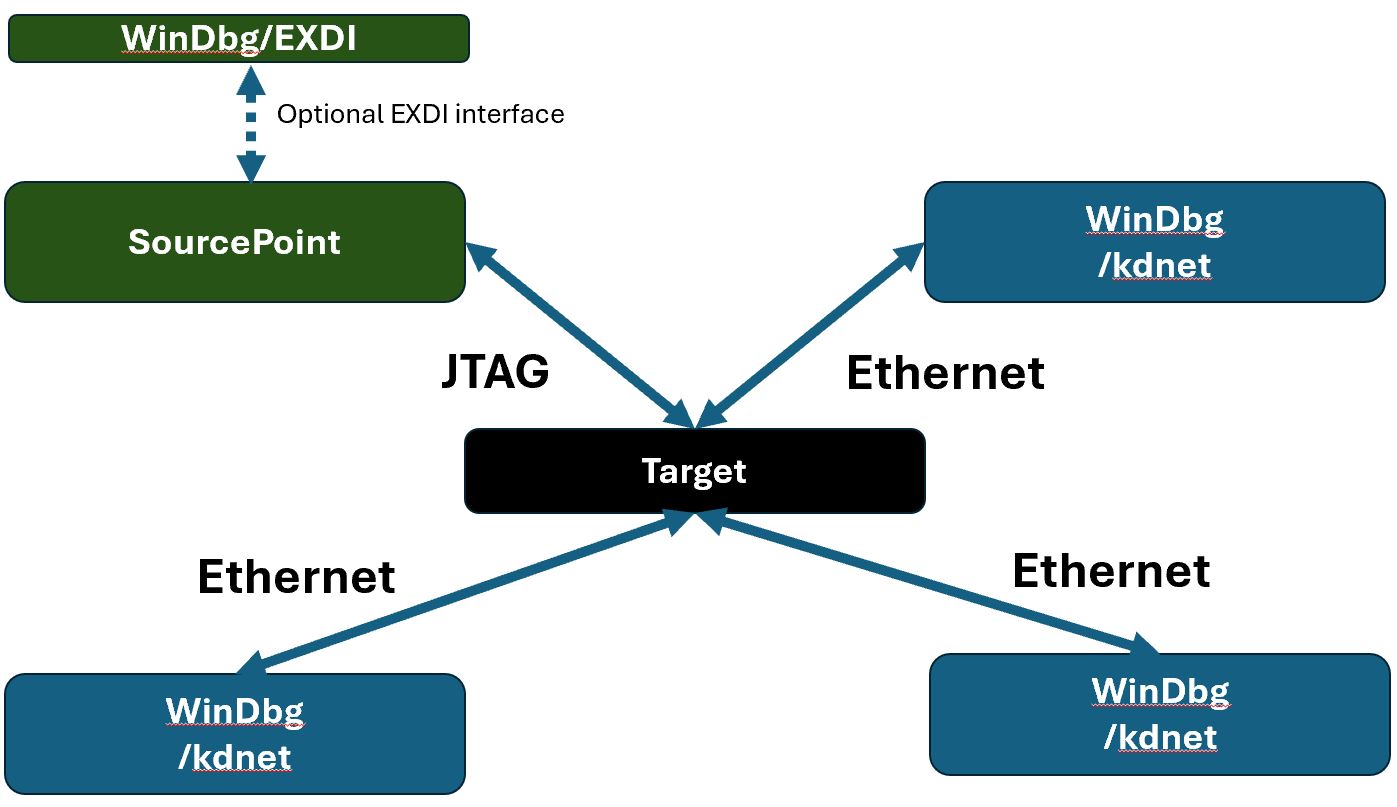
In this model, for example, the WinDbg instances are debugging the hypervisor, Secure Kernel, and regular NTOS (for example, ntkrnlmp); and SourcePoint is applying VMX, SMM and software breakpoints across all threads, and running Intel PT and AET in the background!
As an example in a four-processor system in the image above, you can have CPU #0 in the hypervisor, CPU #1 in secure kernel, and CPU #2, 3 in NT, and you can debug them all at the same time.
I’ll illustrate some additional great use cases for this star topology in forthcoming articles. Suffice to say for now that this fulfills Andrea’s vision:
“We’ll use SourcePoint WinDbg when regular debuggers cannot do the job (i.e. for trap handlers, transition code, KVA shadow, NMI, MCE, and so on…)”.
For those with an interest, SourcePoint WinDbg can be purchased at a special price for individual researchers and hobbyists. To learn more, go to our SourcePoint WinDbg product page.