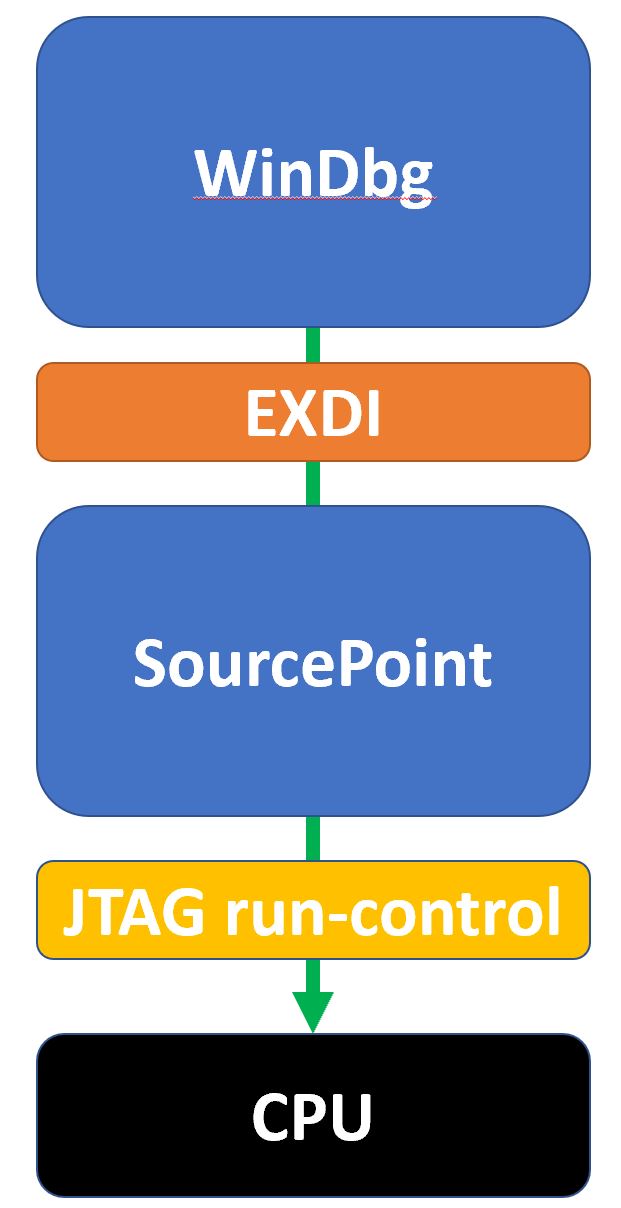
If you’ve been following some of my other posts, you have seen that WinDbg uses the EXDI interface to connect to SourcePoint, which in turns connects to an Intel CPU via JTAG; this allows WinDbg to do things it normally cannot do, like debug the Windows Secure Kernel. In this installment, I’ll show how, in our upcoming software release, SourcePoint can coexist with multiple copies of WinDbg, to further enhance insight into Windows’ operations.
A common Windows debugging scenario involves using WinDbg in conjunction with a “kdnet agent” (for lack of a better term) running on Windows itself down on a separate physical target. WinDbg communicates to this agent over a socket connection. This approach is very fast, and has the advantage of running on real hardware, as opposed to on a virtual machine target. This solution is also very powerful; but, since the debugger itself requires a software agent running on the target, it has its limitations. What happens if the agent itself becomes inoperative? What happens if you want to debug some Windows code that the agent does not allow, or is dependent upon itself? This is where JTAG and EXDI come in.
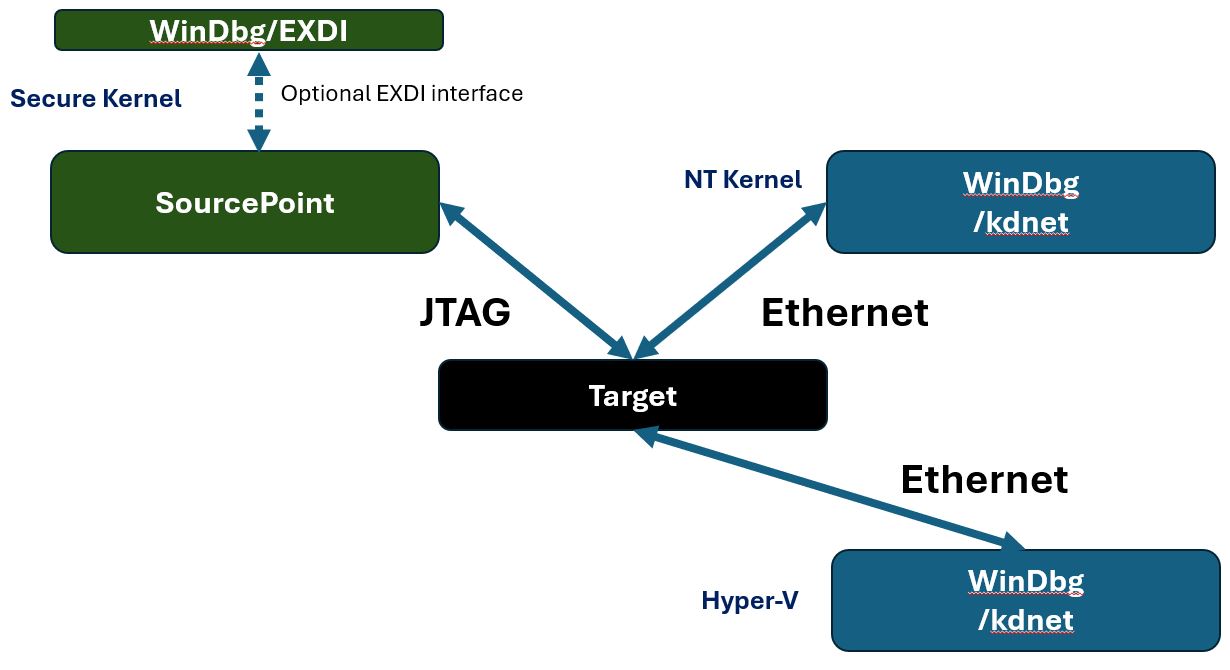
EXDI is a public API that allows, for example, WinDbg to connect to a JTAG debugger and take advantage of its powerful features. One topology looks like this:
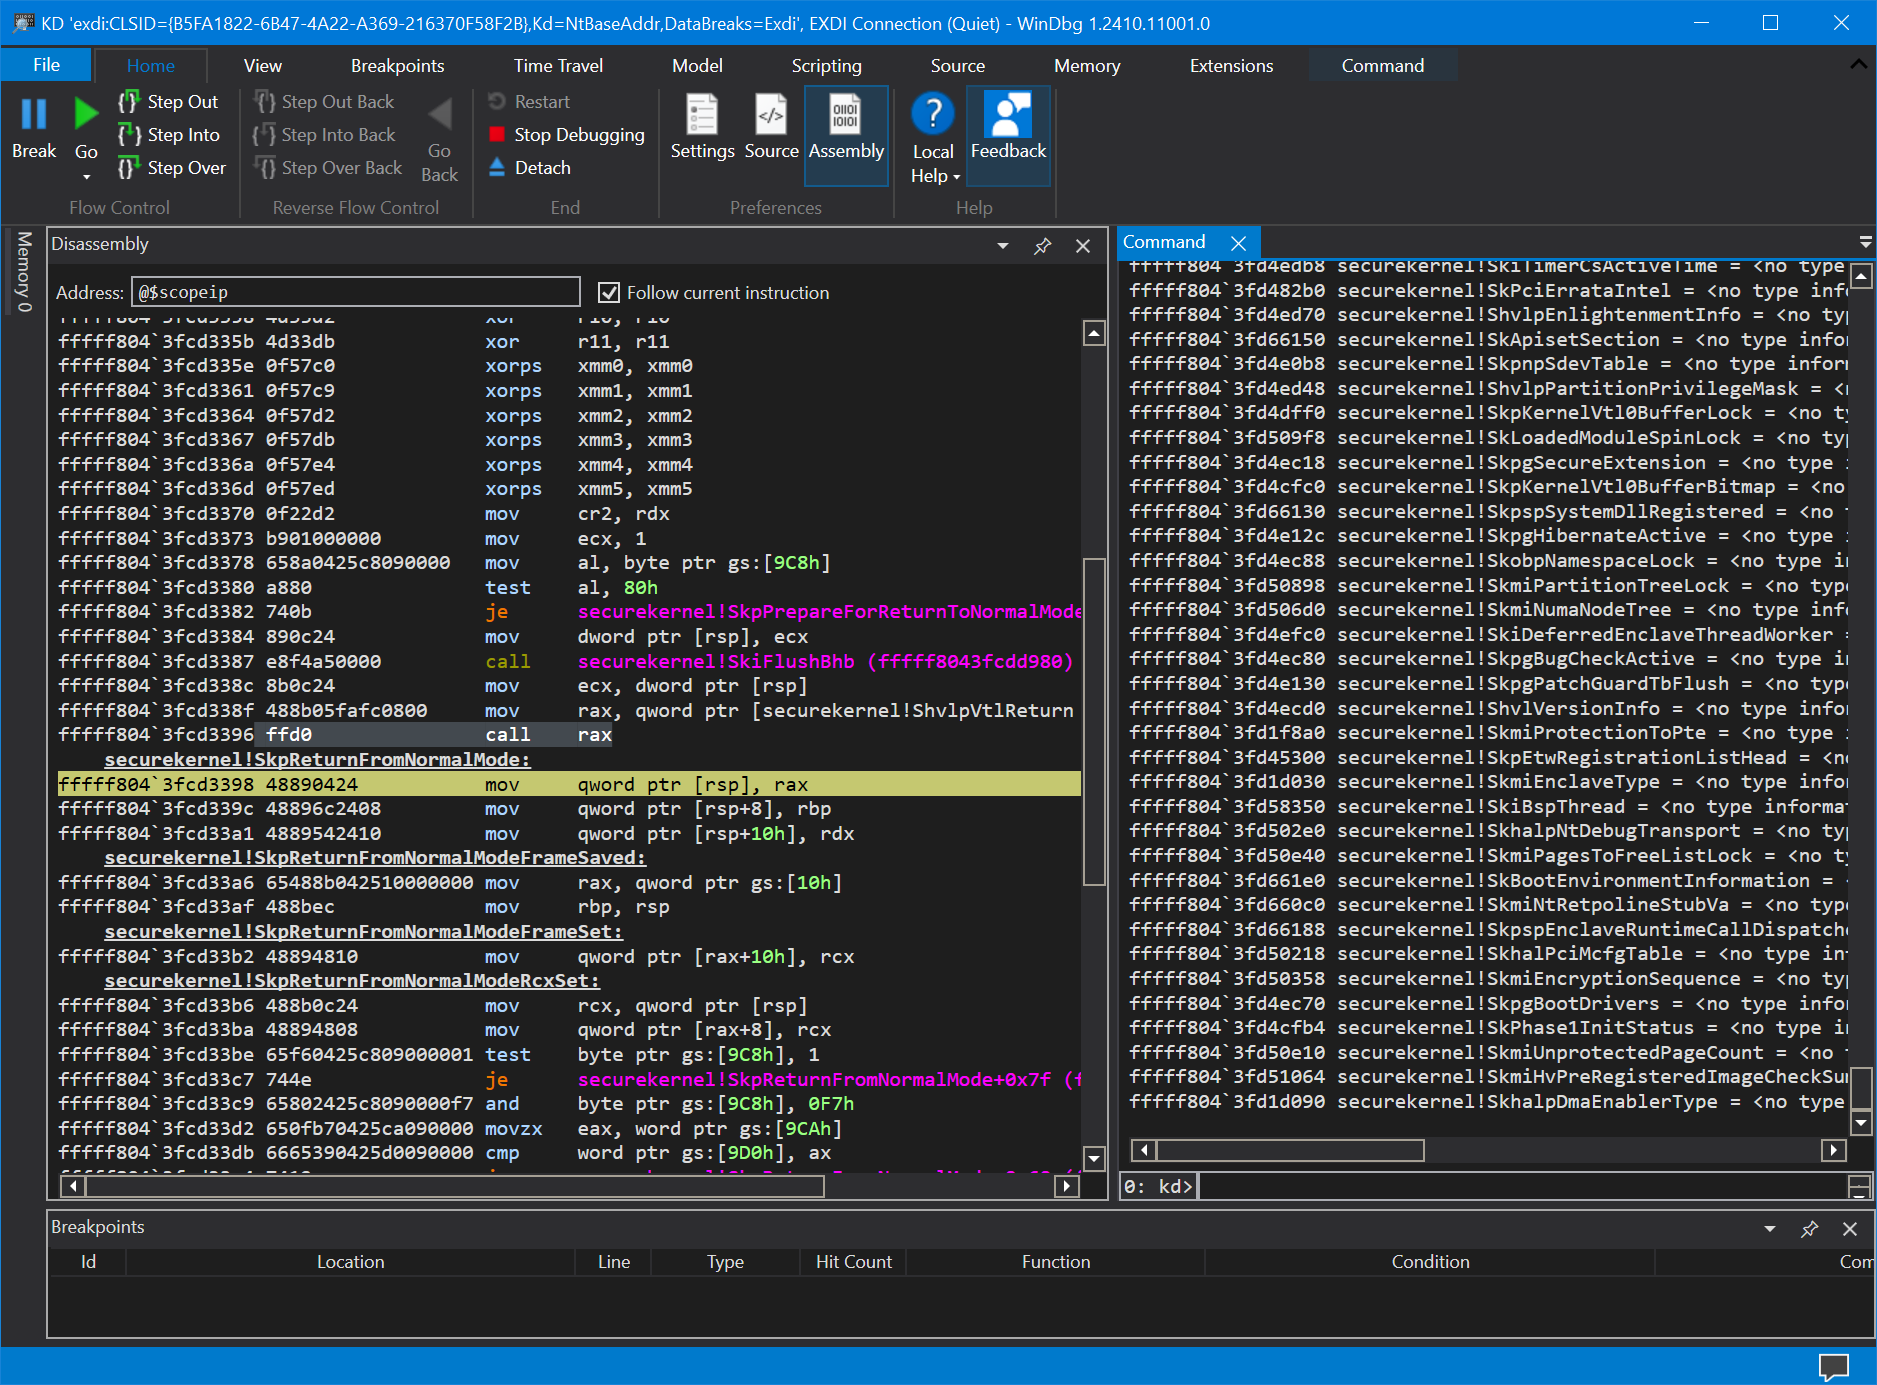
Although there are dozens of things that a debugger using EXDI/JTAG can do that kdnet cannot, one excellent example is debugging the Windows Secure Kernel, as in the below image:
There is simply no other way to do this without JTAG.
ASSET’s SourcePoint JTAG-based debugger was originally designed for UEFI debug, and about a year ago we started to enhance it with Windows OS-aware capabilities, now being able to “debug the undebuggable”, so to speak (with a nod towards Andrea Allievi of Microsoft for his landmark article).
If you have time, I would recommend some background reading:
Seven groundbreaking new features for Windows kernel debug
Getting Started Guide for the AAEON UP Xtreme i11 Tiger Lake board
Now, I’ll describe the steps necessary to connect multiple WinDbg instantiations to Windows: one for the Secure Kernel, one for Hyper-V, and one for NTOS.
Here’s what it will look like when you’re done:
Although, of course, other topology combinations are possible.
EDITOR’S NOTE: Using multiple debuggers on a real physical target is a very advanced debugging technique, and requires a strong knowledge of both SourcePoint and WinDbg. It’s important to keep in mind that SourcePoint and WinDbg have two different definitions of Running versus Stopped. When SourcePoint uses JTAG to do a “Stop”, it is “coming up from the basement”, so to speak – the CPU is actually physically stopped at the silicon level. When WinDbg does a “Stop”, the target (and its kdnet agent) is still running, but code flow is halted.
You’ll first want to set up two ports for the two WinDbg/kdnet sessions, 50000 for NTOS and 50001 for Hyper-V as used in these examples. First, follow the directions here: Set up KDNET network kernel debugging automatically.
Then, on the target, open a Windows Administrator command prompt, and type:
bcdedit /dbgsettings net hostip:192.168.32.128 port:50000 key:1.1.1.1

bcdedit /hypervisorsettings net hostip:192.168.32.128 port:50001 key:1.1.1.1 busparams:0.31.6

bcdedit /set hypervisordebug on

bcdedit /set debug on

bcdedit /set {dbgsettings} dhcp yes

bcdedit /set {dbgsettings} busparams 0.31.6

bcdedit /set {default} loadoptions "systemwatchdogpolicy=disabled"

bcdedit /set recoveryenabled No

bcdedit /set bootstatuspolicy ignoreallfailures
Note that the IP address of your debugger host PC will be different than what’s listed above.
Then, reboot the target.
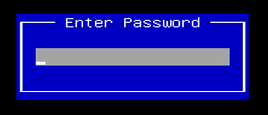
Hold down the F7 key, that puts you into the UEFI password prompt for the AAEON UP Xtreme i11 Tiger Lake board:
On your debugging host PC, type in the following:
For WinDbg Classic:
C:\Program Files (x86)\Windows Kits\10\Debuggers\X64\WinDbg.exe -v -k net:port=50000,key=1.1.1.1

C:\Program Files (x86)\Windows Kits\10\Debuggers\X64\WinDbg.exe -v -k net:port=50001,key=1.1.1.1
For WinDbgX:
WinDbgX.exe -v -k net:port=50000,key=1.1.1.1

WinDbgX.exe -v -k net:port=50001,key=1.1.1.1
Of course, instead of typing the above commands, you can just launch WinDbg Classic or WinDbgX, and do a File > Attach to kernel.
Both of the WinDbg sessions will sit displaying the “Waiting to reconnect…” message.
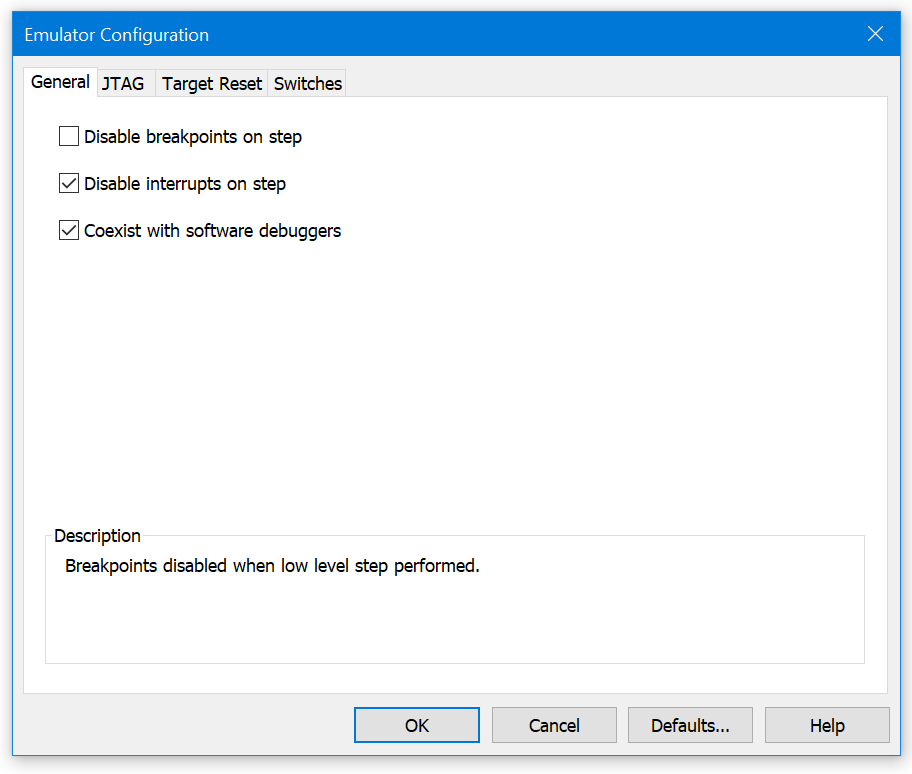
To start off your debugging sessions with SourcePoint, you need to tell it that it is sharing the limelight with other software debuggers; so that for example if a software breakpoint is set in WinDbg, it won’t trip SourcePoint up. Do this by going into the Options menu, Emulator Configuration, and in the General tab enable “Coexist with software debuggers”:
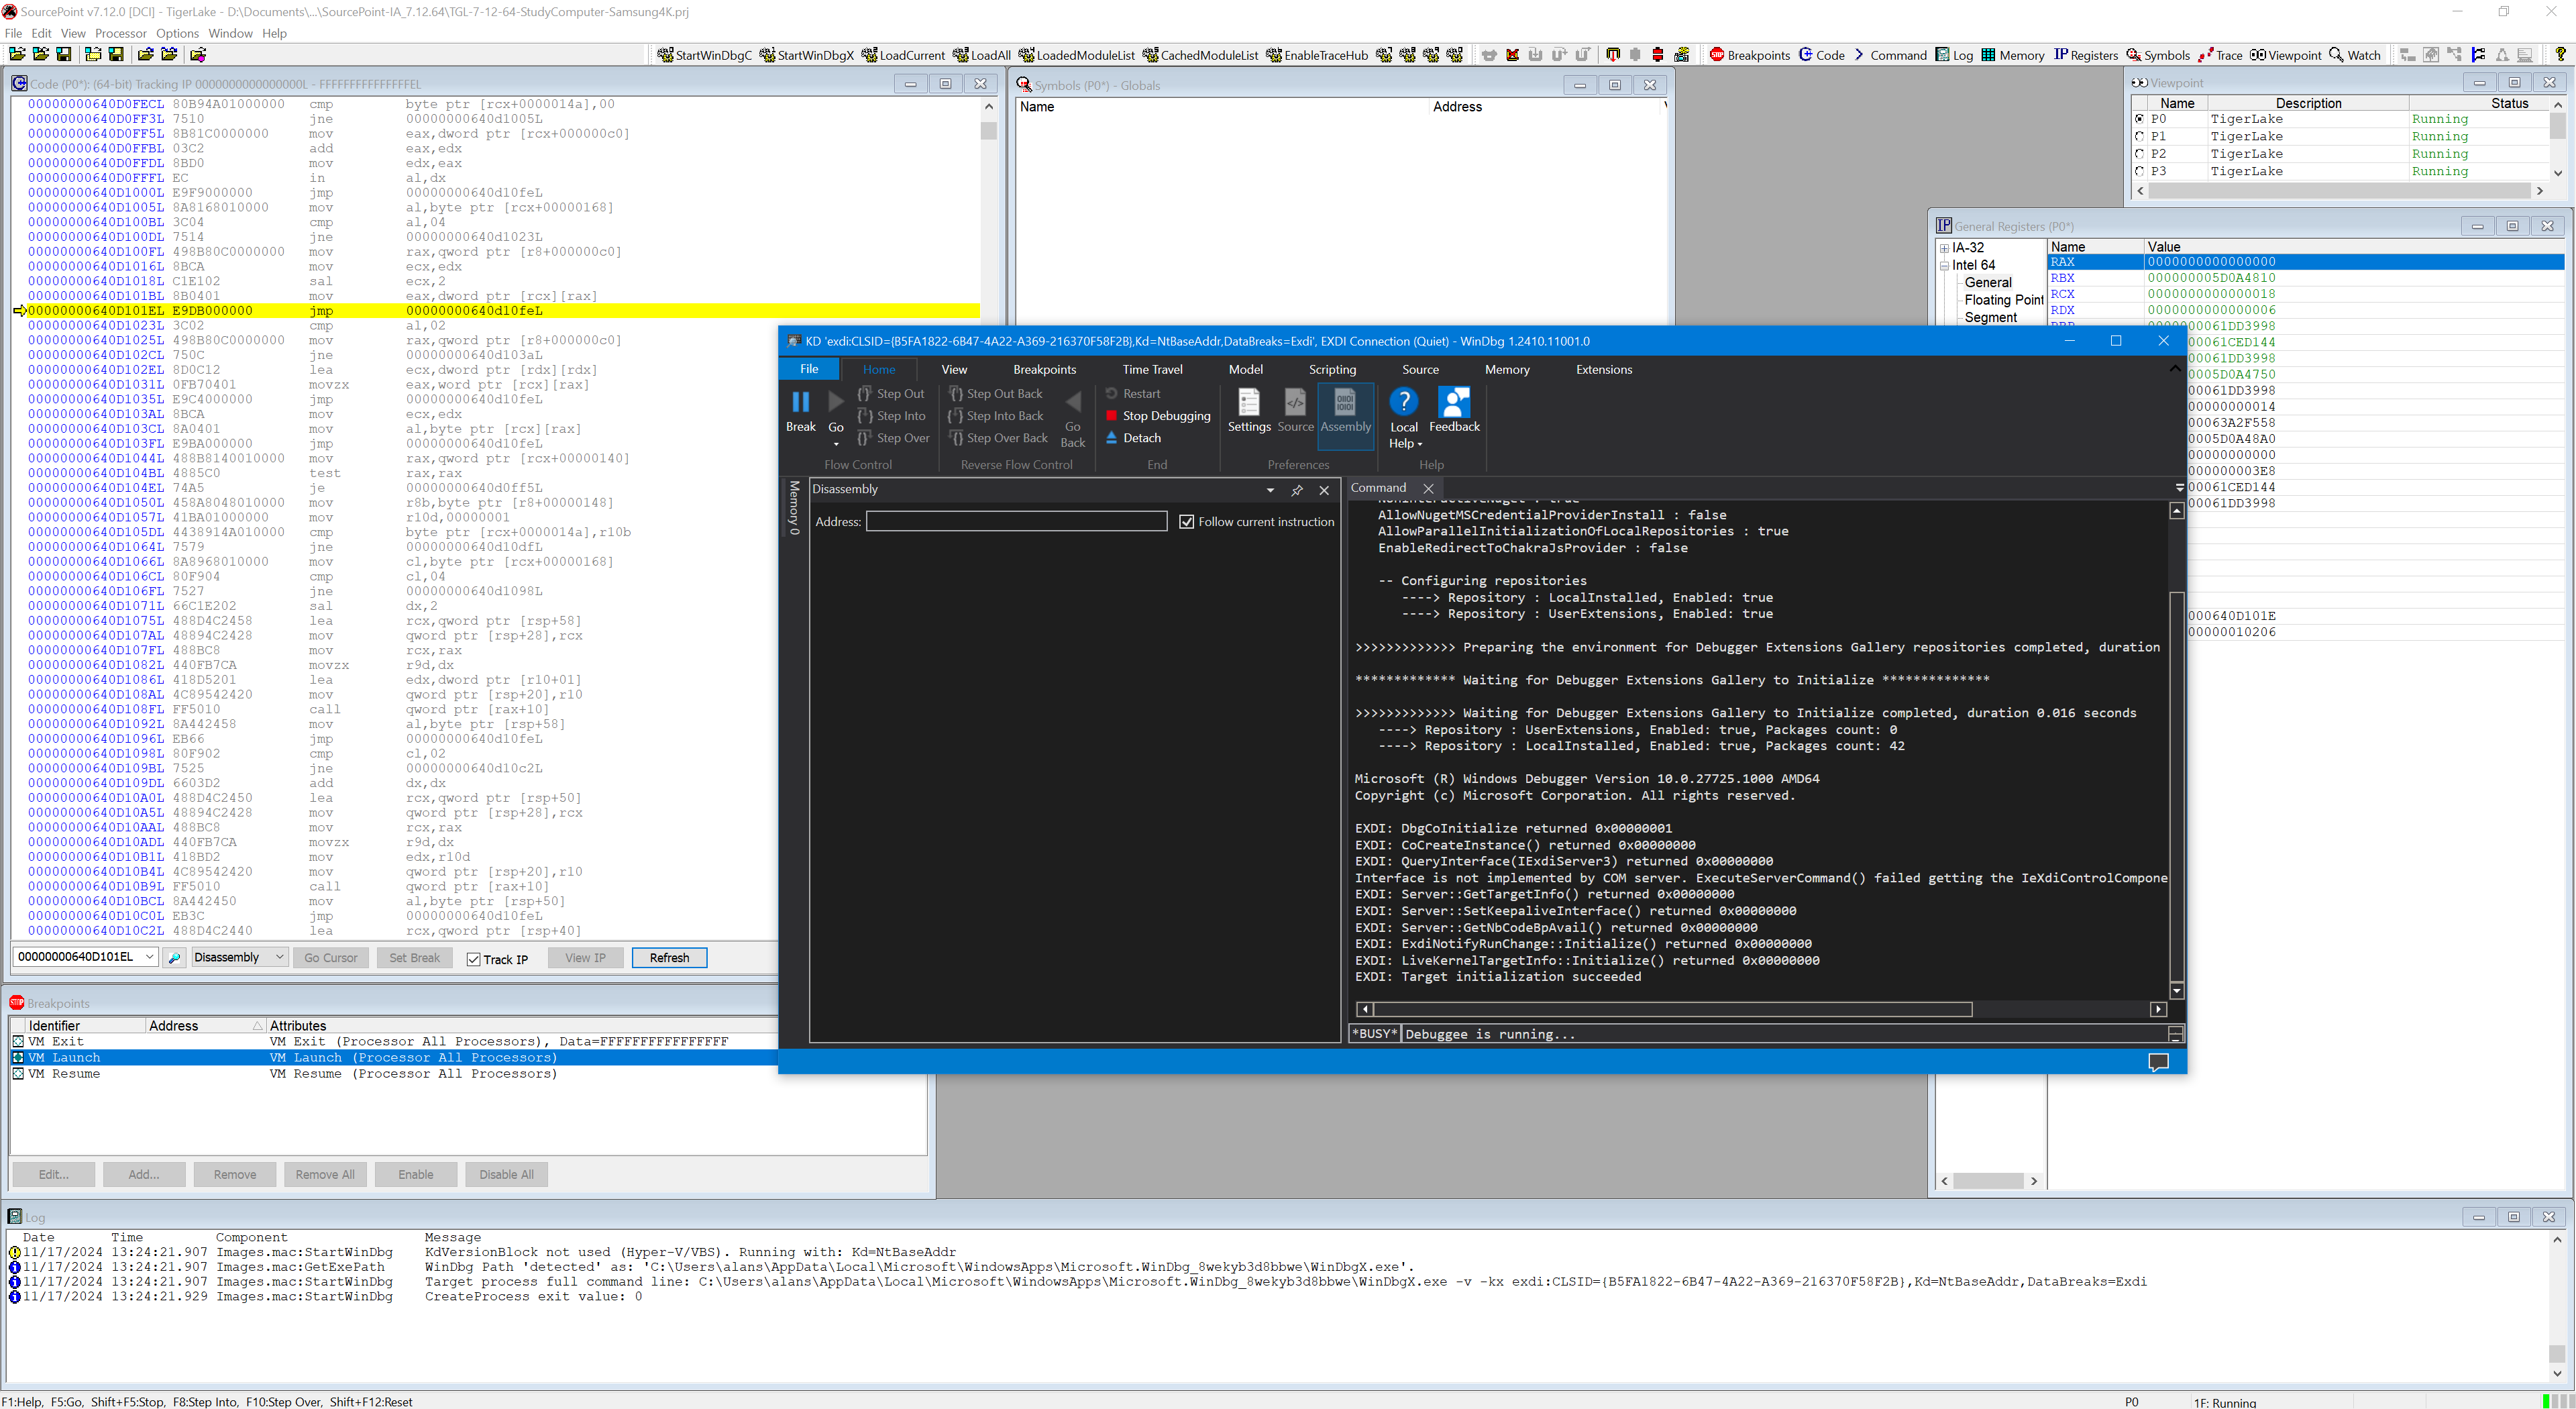
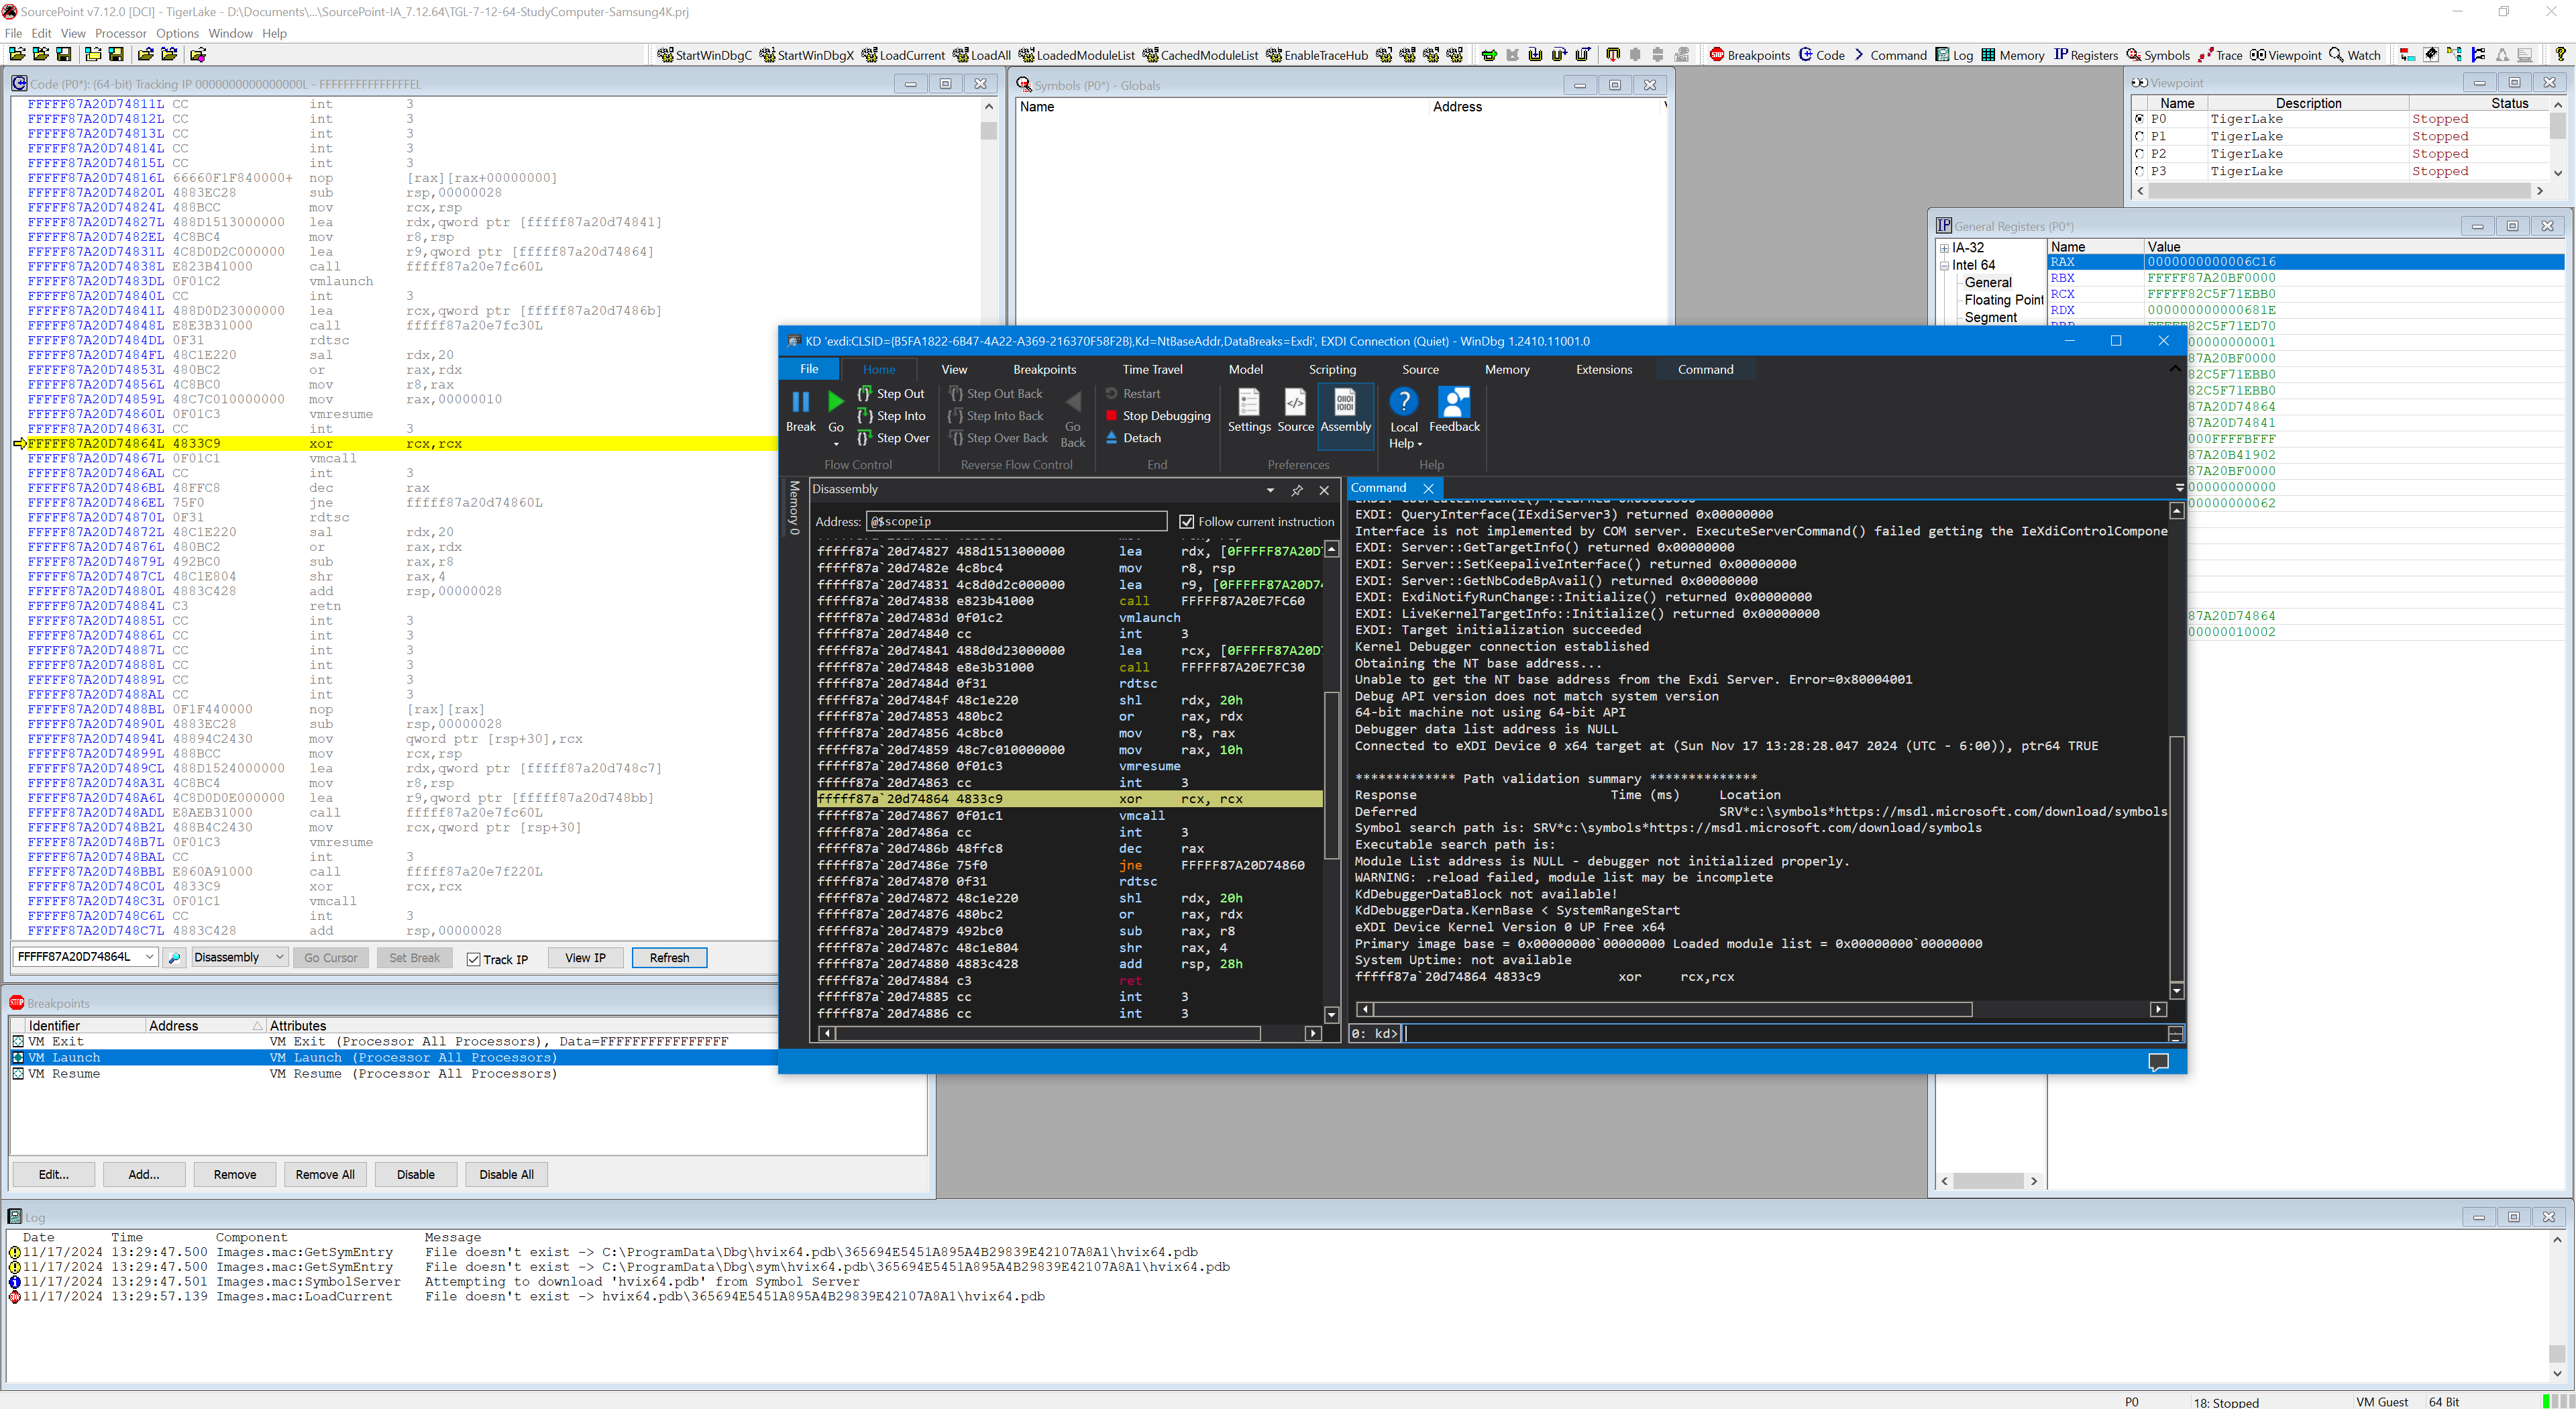
Now, launch SourcePoint, launch your Project to connect to the target, halt it, and set a VM Launch breakpoint. Then hit Go again. Then click on the StartWinDbgX (Preview) or StartWinDbgC (Classic) macro button to establish the EXDI connection between WinDbg and SourcePoint:
Then, hit Enter a couple of times from the AAEON BIOS password prompt to begin the boot into Windows. The individual WinDbg sessions will become active when the appropriate boot phase has been entered. Your mileage may vary, but the below sequence of events is typical.
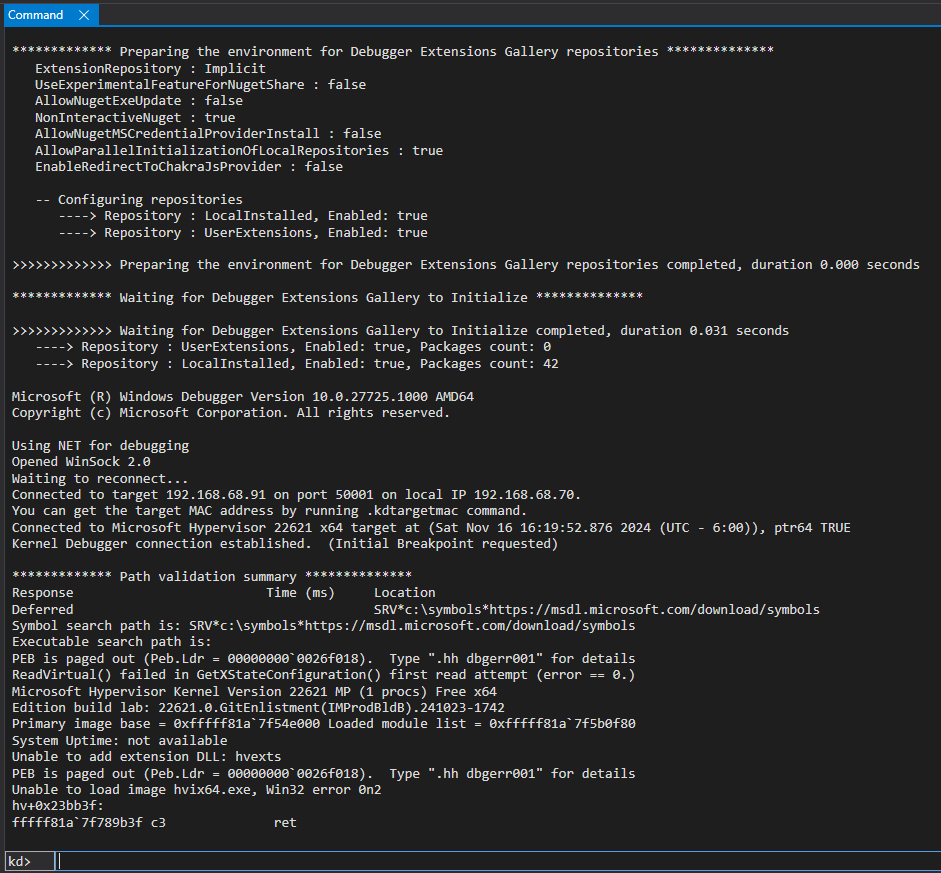
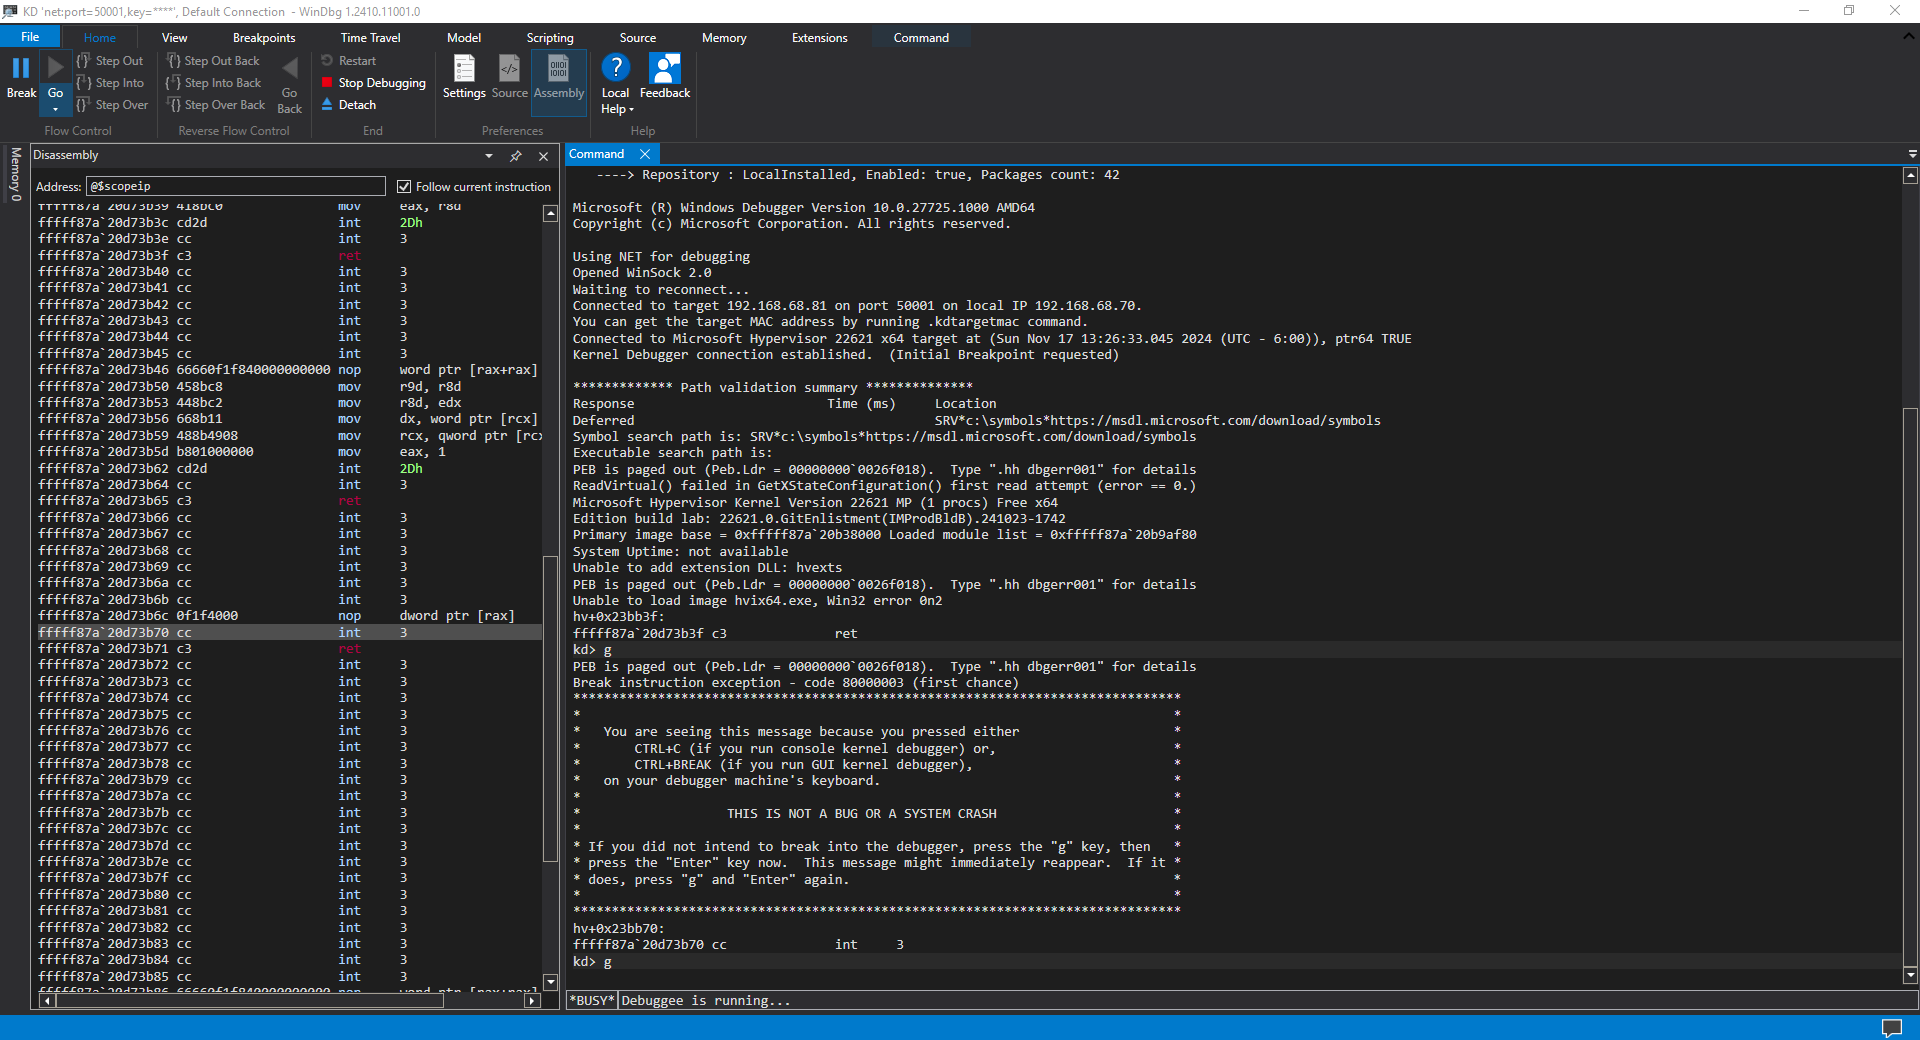
First, Hyper-V (hvix64) breaks at hv+0x23bb3f or thereabouts, at a RET instruction:
Nothing useful is displayed in the Disassembly window (yet).
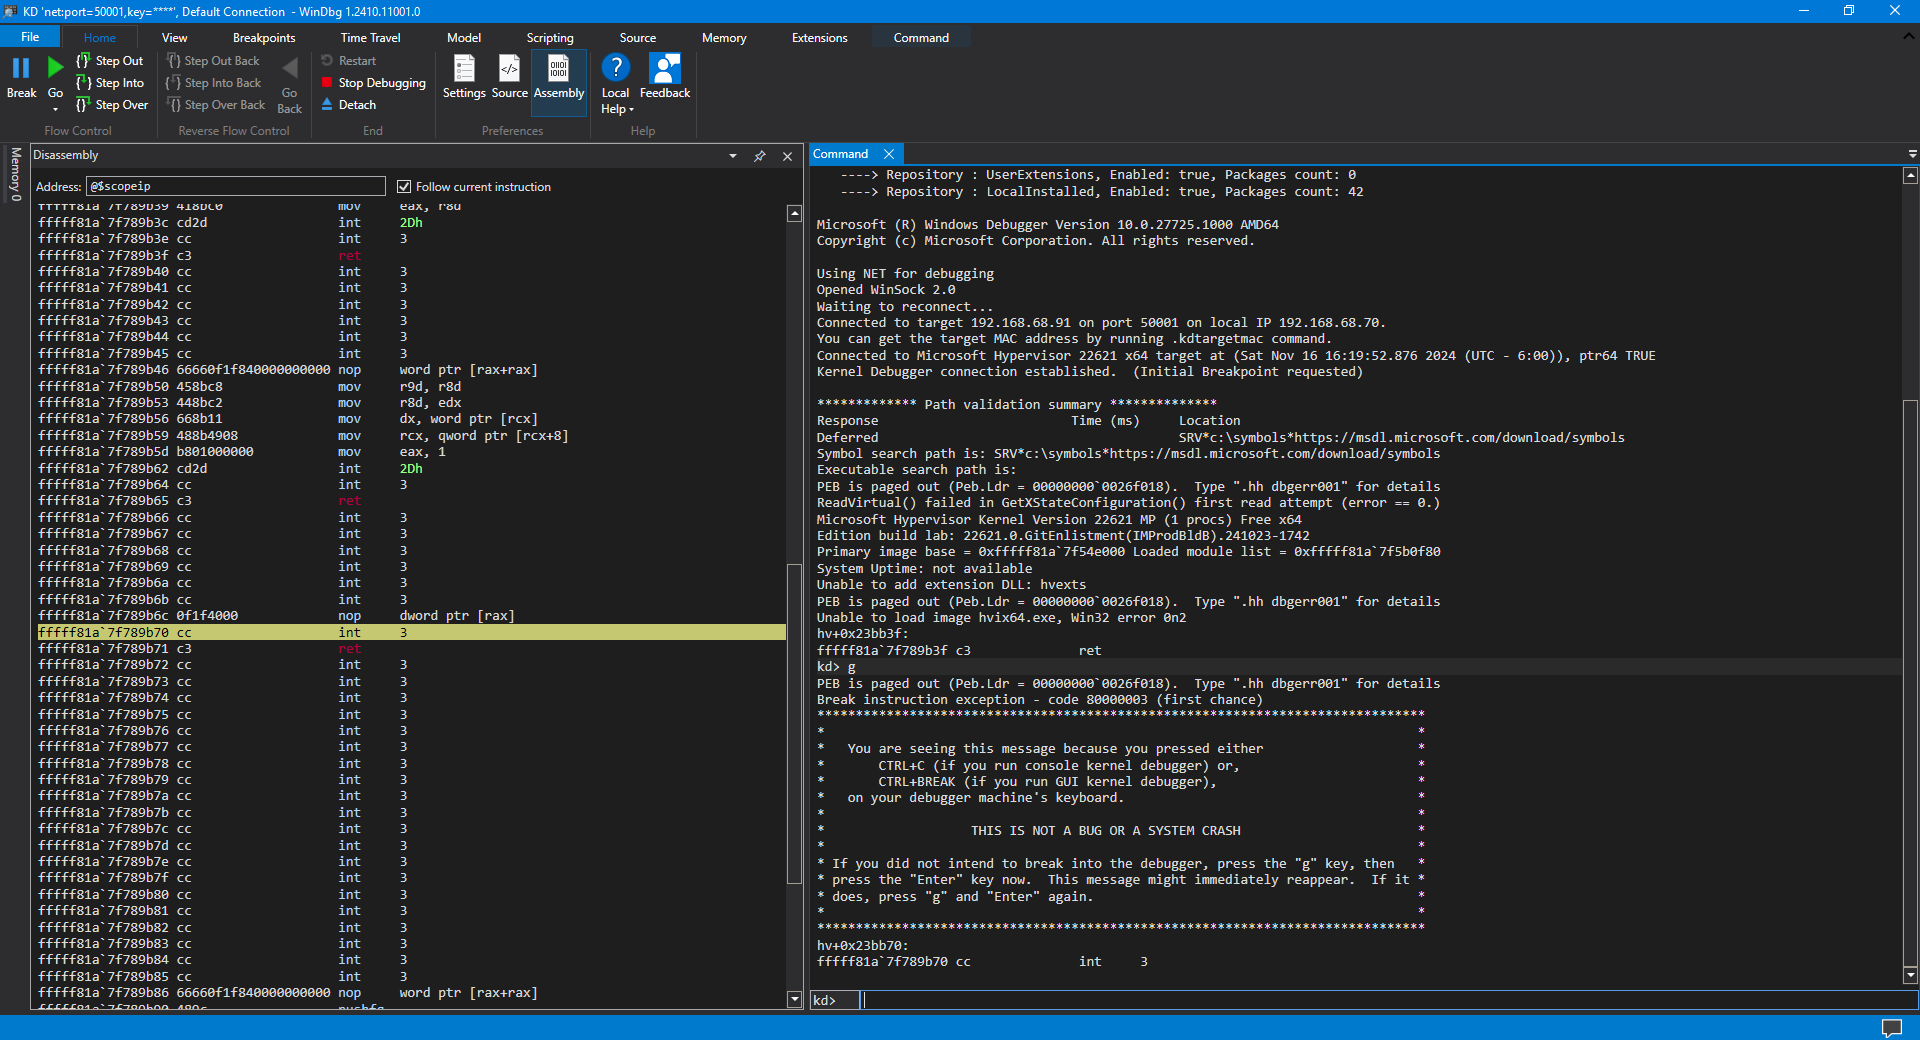
Hit Go in this WinDbg instance. You’ll see:
This time we break at ffffff81a’7f789b70 (hv+0x23bb70) or thereabouts, on an INT 3 instruction.
Hit Go a second time in the HV instance of WinDbg. You’ll see that SourcePoint WinDbg hits the first VM Launch breakpoint in hvix64 as a Guest:
And the HV debugger goes into a “*BUSY* Debuggee is running…” state:
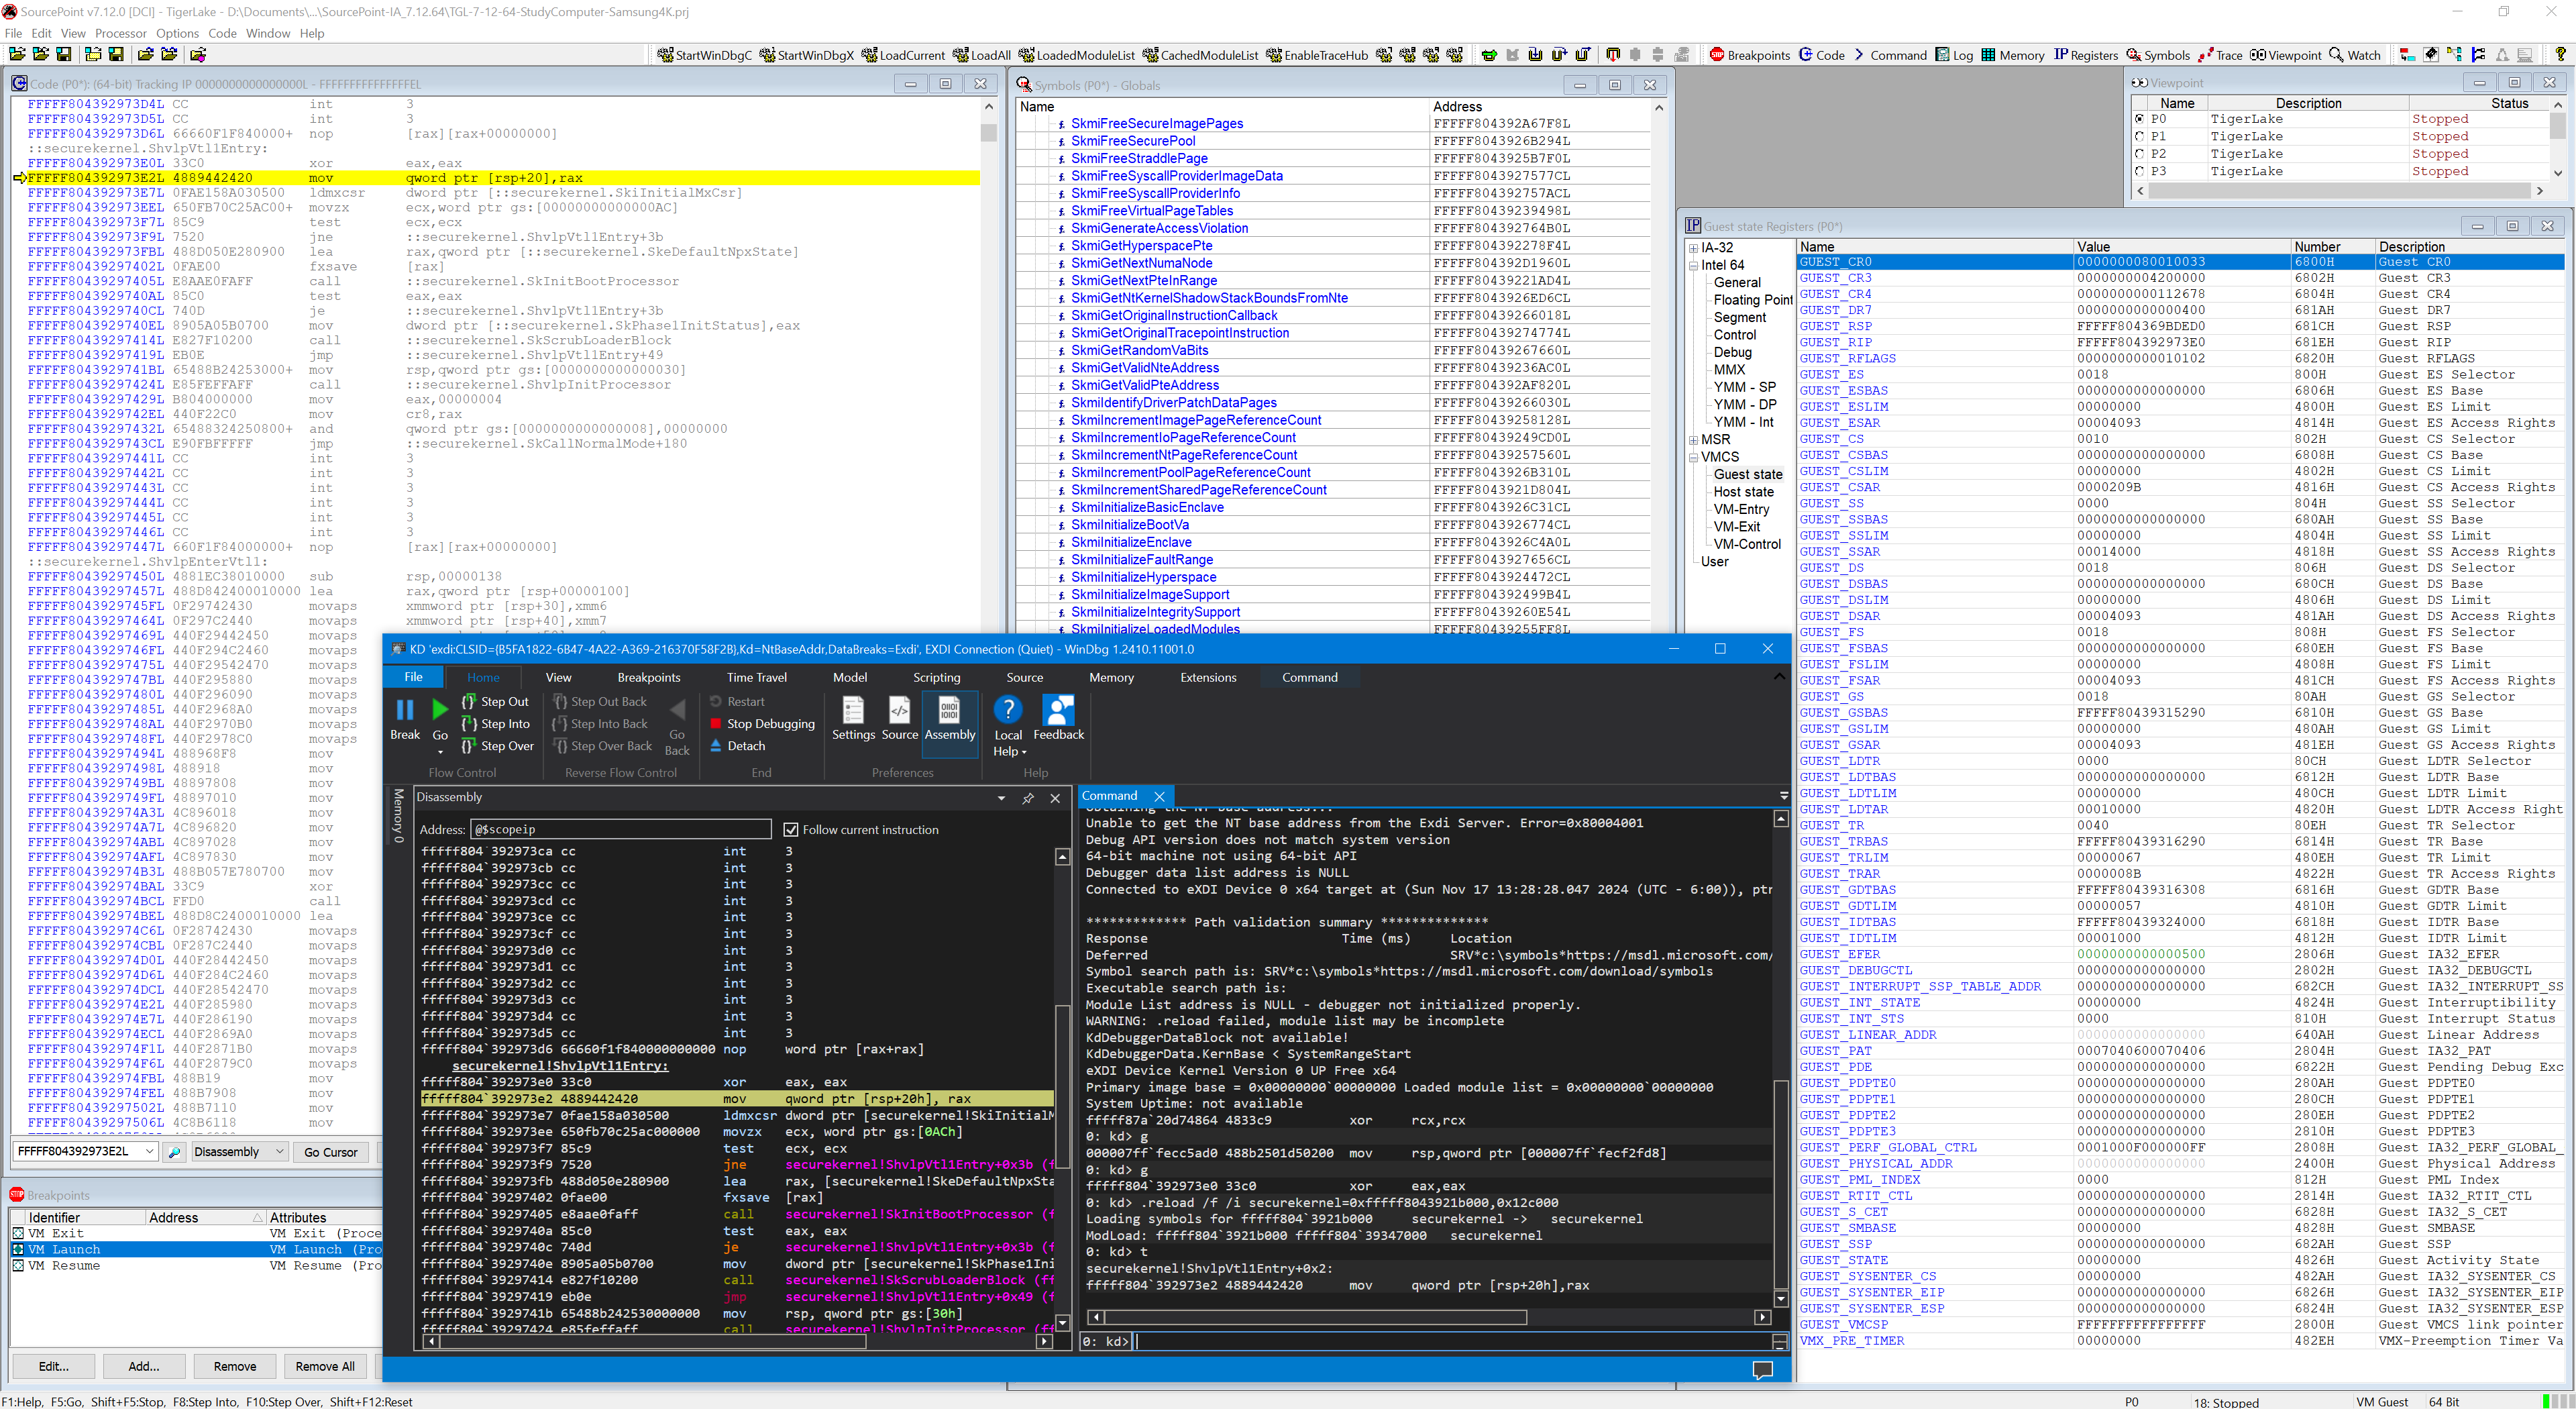
SourcePoint/JTAG has control of the target now (all threads are Stopped, and both the kernel and HV WinDbg instances are in a BUSY state), so to get to the next couple of VM Launch breakpoints, you need to issue a Go from within WinDbg/EXDI. The first Go lands you in hvloader (as you will have seen in several of my previous blog posts). The second Go lands you in the Secure Kernel at the entry point to ShvlpVtl1Entry. Do a LoadCurrent from within SourcePoint to make the symbols visible there. And SourcePoint will instruct you how to load the symbols as well within WinDbg, for example with:
.reload /f /i securekernel=0xfffff8043921b000,0x12c000
I had to take a single step from within WinDbg/EXDI to get the symbols to display as well within WinDbg:
You now have the full power of SourcePoint to debug the Secure Kernel!
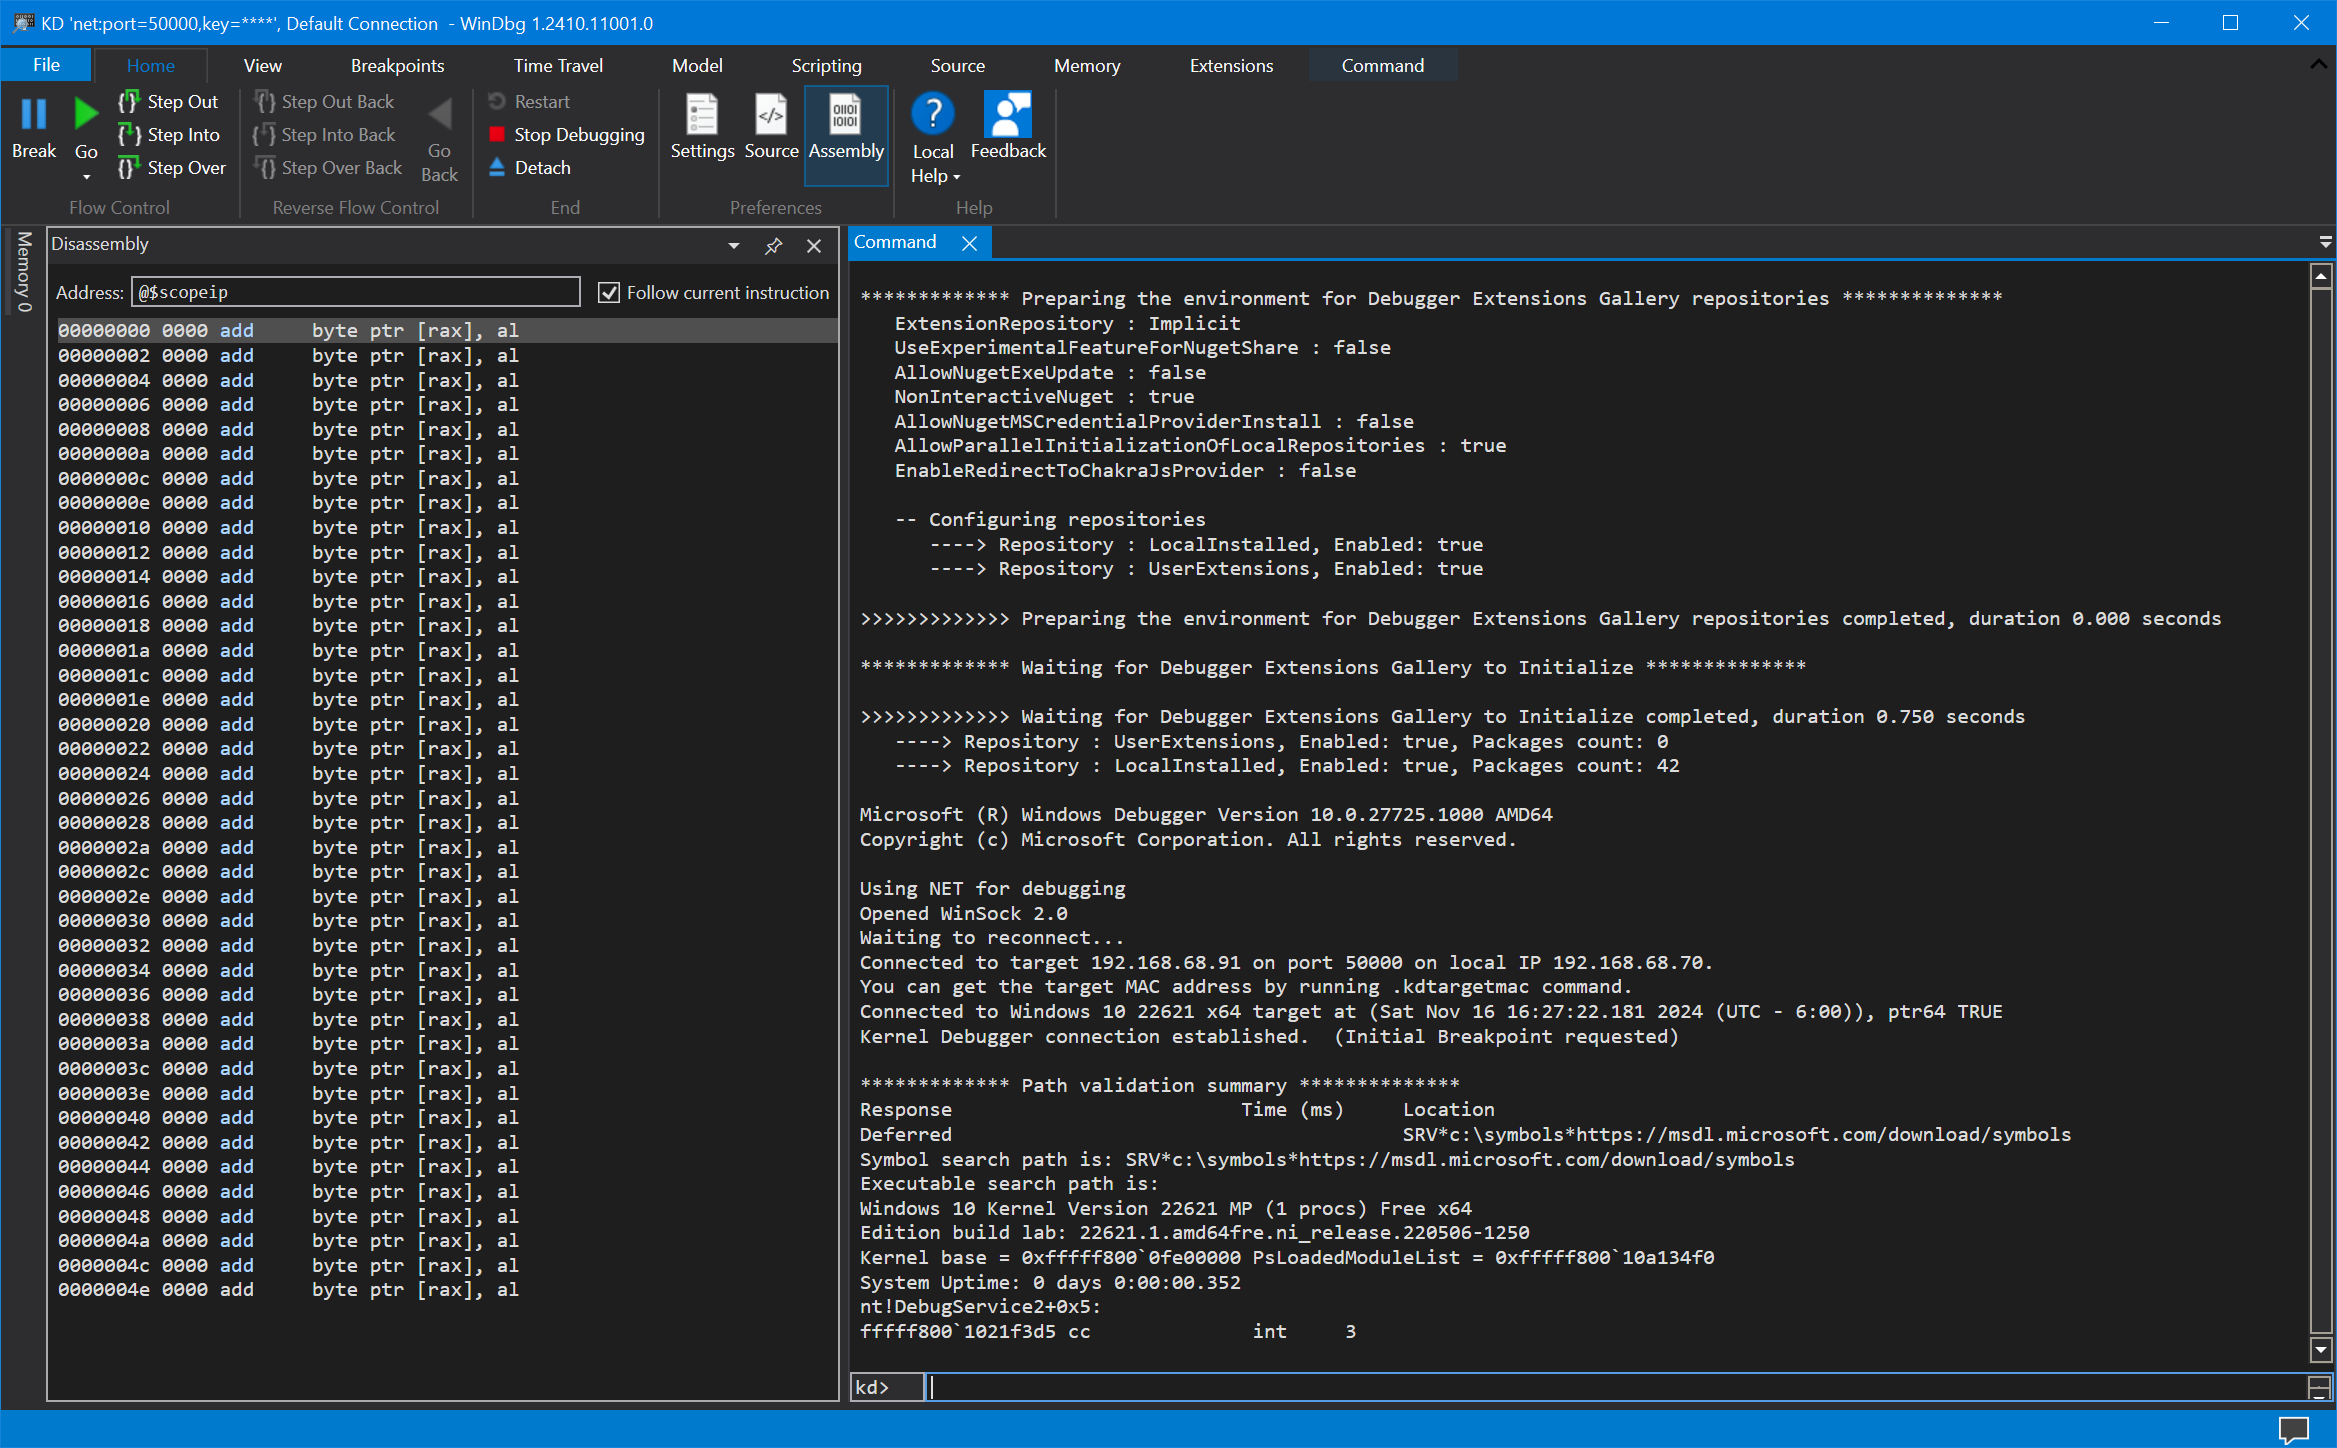
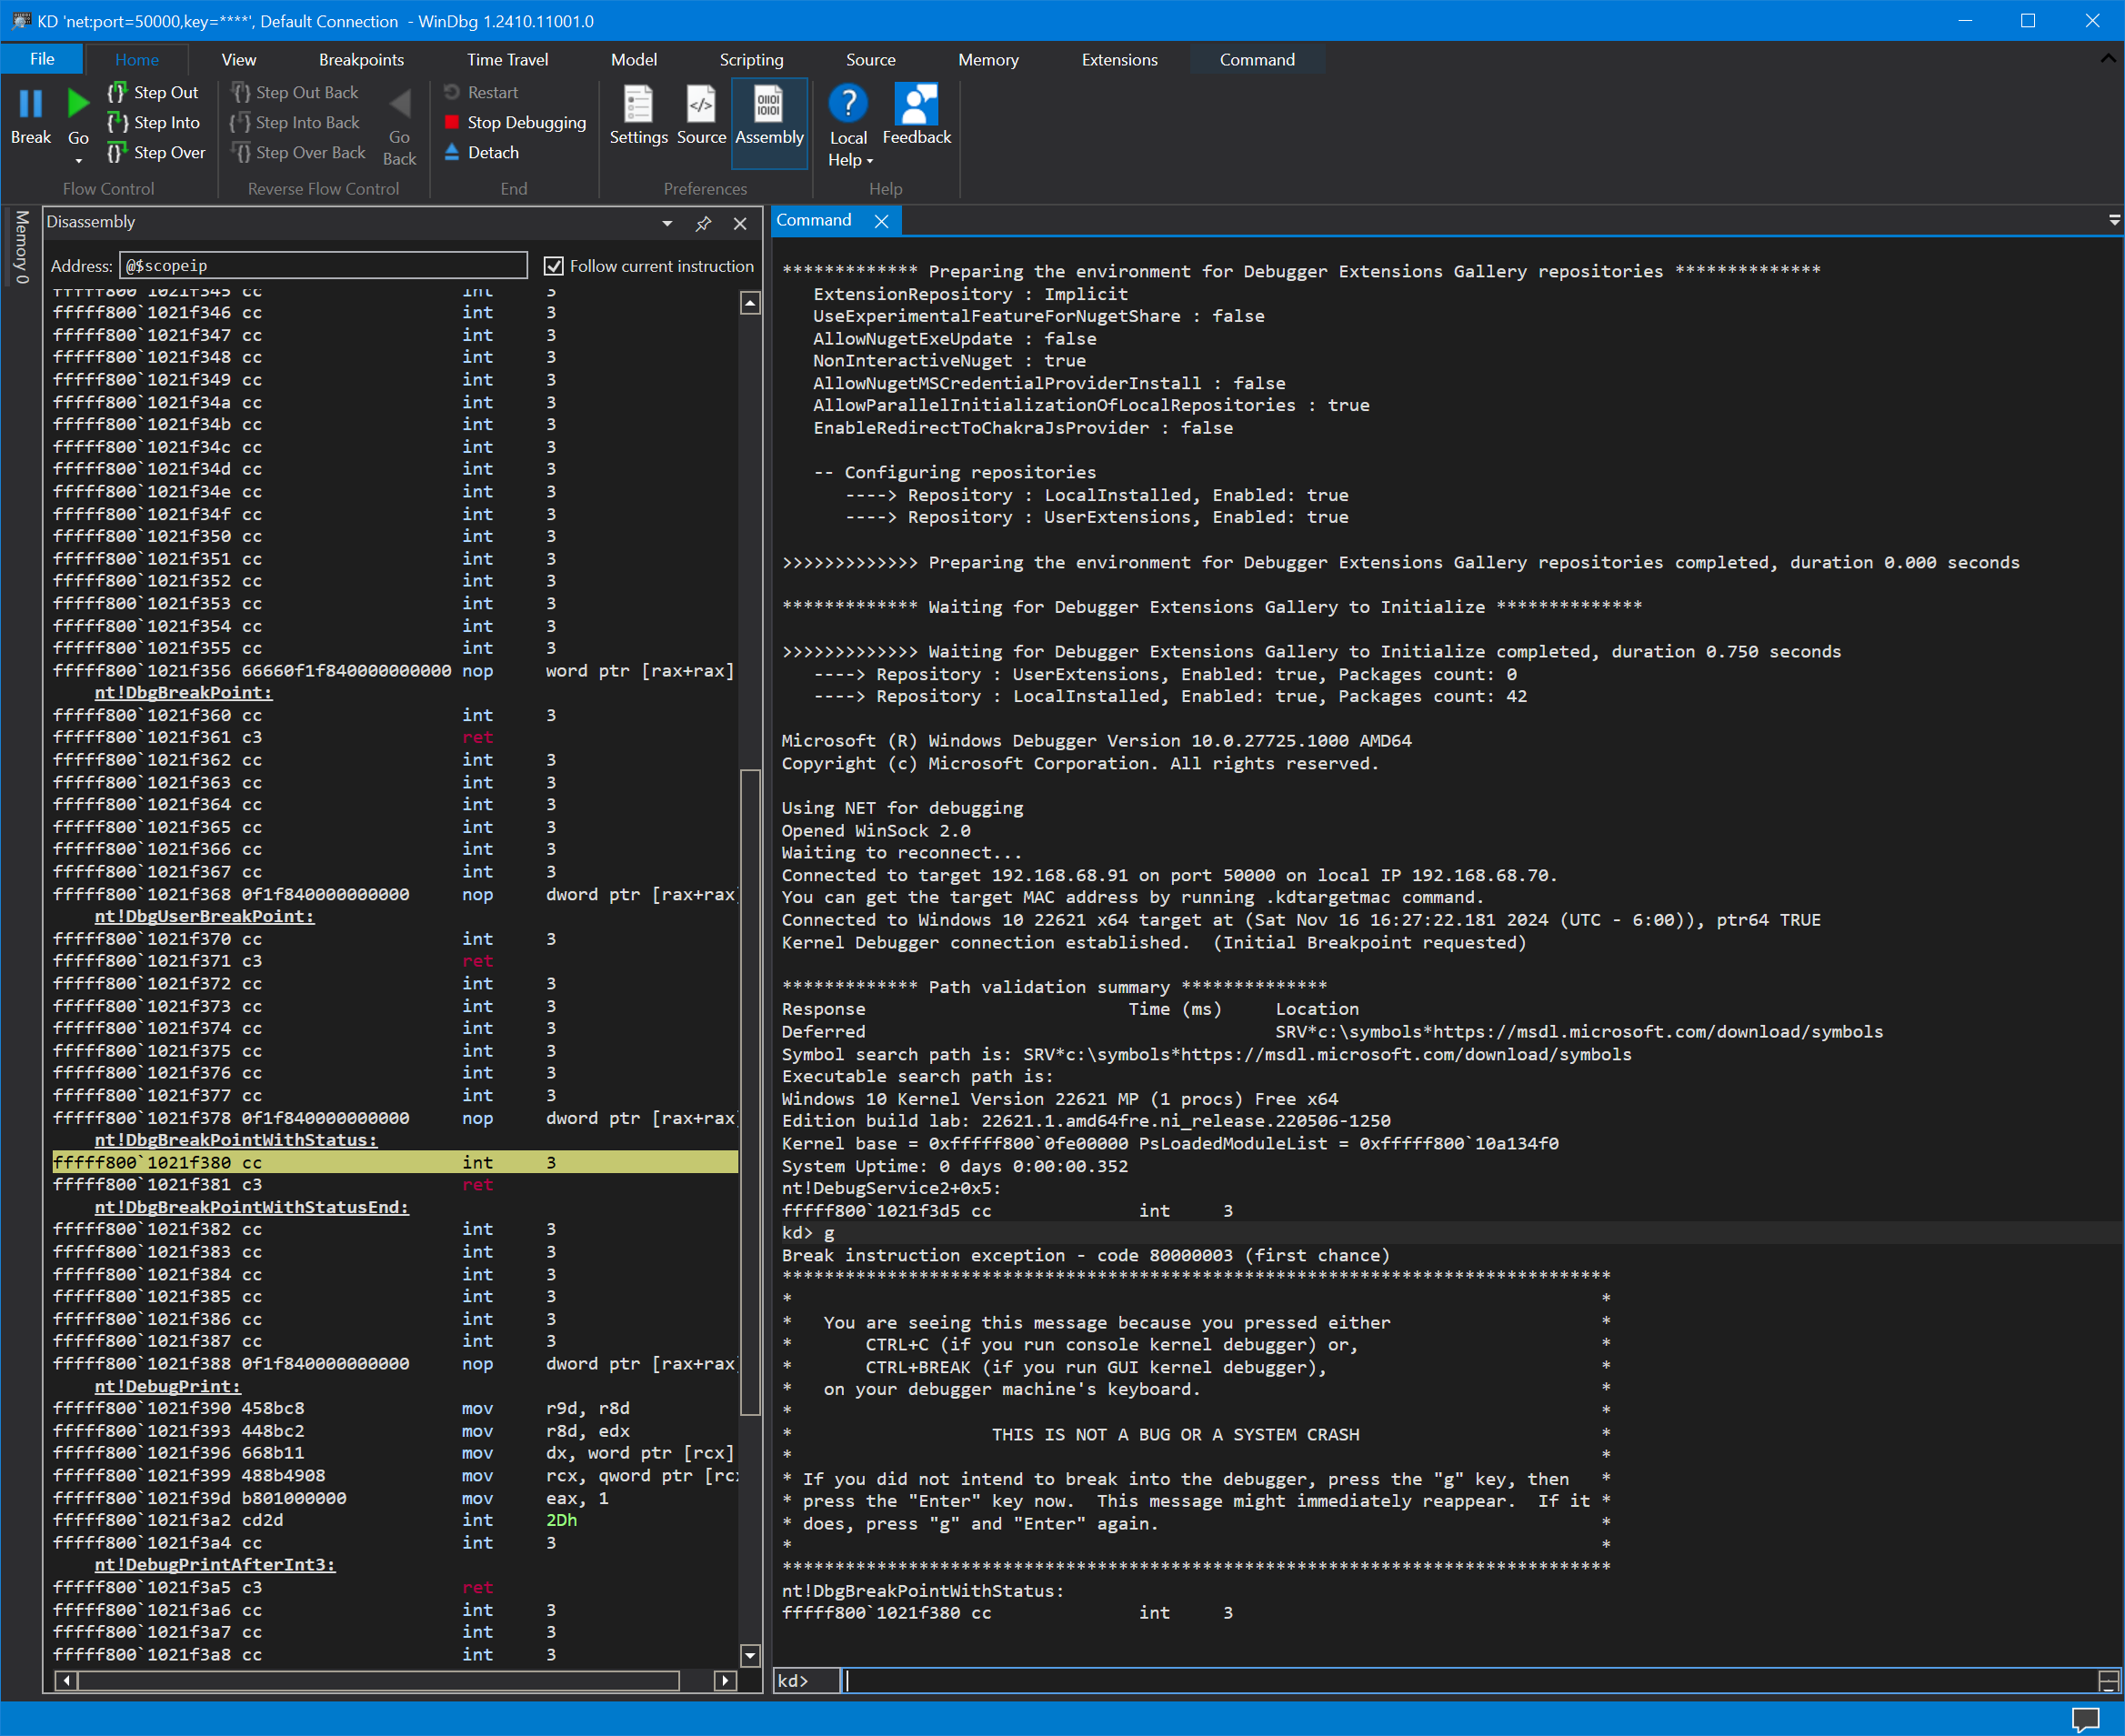
One final step: you can now uncheck the VM Launch breakpoint in SourcePoint, and hit Go from within WinDbg/EXDI. Note that the kernel WinDbg instance (the one on port 50000) now breaks at nt!DebugService2+0x5:
There’s junk in the Disassembly window. Hit Go, this time from within the kernel debugger, and it lands at the familiar INT 3 instruction at nt!DbgBreakPointWithStatus:
You now have three debuggers active! Two WinDbg/KDNET, one each for the Hyper-V and the Normal Kernel; and one WinDbg/SourcePoint/JTAG. You are debugging NTOS, Hyper-V, and the Secure Kernel all at the same time! You can do some amazing things with this. I expect that some talented people will be writing about those shortly.


