
I’m sometimes asked what the value of better debugging tools are, in the context of SourcePoint’s unique JTAG-based functionality for OS development, reverse engineering and malware research. As this is something I’ve learned a lot about over the years, I thought I would capture these insights in a blog post.
First, let’s zero in on the value of debugging and debuggers.
The textbook definition of debugging is “…the process of finding the root cause and fixes for bugs”. For the purpose of this article, we’ll extend the normal definition of bugs to include all of software design errors and rogue code designed for malicious purposes. In both cases, debugging is intended to identify faults, vulnerabilities and intrusions (malware) that cause software to diverge from its intended purpose. Code errors/bugs and vulnerabilities/malware are very closely related.

All software developers do debugging. You can’t avoid it: code of any complexity almost never works upon the first run. Even the repetitive process of editing, building, running the code and eyeballing what might be going wrong is a form of debugging – albeit a very primitive kind that involves a human being as “the debugger”.
More sophisticated applications demand more sophisticated debugging methodologies. As our SourcePoint product has its roots as a BIOS (UEFI) debugger, I have watched more times than I can count the use of the “printf” approach. That is, a UEFI image is modified to include a number of “print” statements (named printf in the UEFI world) in the area of debugging interest. The image is then rebuilt, flashed back down onto the hardware using a DediProg or similar flash programmer, and then run again on the target with serial output enabled. The engineer watches the serial output on a monitor and sees if his/her printf statement is executed; indicating either success or failure.
Of course, this approach is very time-consuming. You need a lot of patience to debug this way. And there are other drawbacks too numerous to go into here; one of which is that these “debug” images tend to run more slowly than regular release builds, sometimes masking the root cause: the so-called “Heinsenbugs”.
Unfortunately, many UEFI engineers never graduate beyond the printf stage. Although it’s tedious and a productivity sinkhole, it works, and printf doesn’t require an investment in better tooling – especially applicable to those with little interest, motivation or financial wherewithal to spend on and learn new debugging approaches.
And debuggers? That’s easy: tools that do debugging. They can be free, or charged for; open source or closed source; implement basic run-control (breakpoints, single step) or provide access to advanced trace features; and so on. Engineers with limited funds will gravitate towards free or low-cost solutions. Large enterprises will invest in power tools to enhance engineering productivity, solve bugs faster, and accelerate the time-to-market of their software products.
Surprisingly, many engineers avoid the use of advanced debuggers, and in fact take pride in not using a debugger. One of the best “opinion pieces” I’ve seen is the interview with John Carmack, who co-founded id Software, and was the lead programmer for games such as Wolfenstein 3D, Doom, Quake, and many others. An excerpt of the recorded interview with Lex Fridman is here: Game development using powerful debugging tools; and the full interview is at John Carmack: Best programming setup and IDE (note, it’s only 15 minutes long, and well worth sitting through):

Among one of the best quotes from John was:
“The debugger is the way you gain insight into something that is just too big to understand.”
That sounds like Windows, right?
Given the above general description of debuggers and debugging, I’ll turn my attention to ASSET’s SourcePoint WinDbg tool, and talk about that for a moment. Who uses it? Why use it instead of other debuggers? And what problems does it solve?
Who Uses It?
Everyone who uses the SourcePoint WinDbg debugger falls into mainly one of four categories:
OS/Hypervisor Developers: Obviously, anyone who is doing development and debug of the Windows operating system will benefit from using a tool that is enormously more powerful than something like, say, Microsoft’s standard WinDbg tool. And the fact that SourcePoint integrates with WinDbg, such that WinDbg commands can be run via JTAG, creates a “1 + 1 = 3” scenario.
Game-Cheat/Anti-Cheat: Kernel-based game anti-cheat mechanisms allow developers to access and analyze the kernel to detect potential cheating activity. The more privileged the access, the greater the anti-cheat’s ability to develop and deter low-level hardware/firmware/kernel cheats. Just about all cheats and anti-cheats operate at the kernel level now. Any tool that enhances the ability to investigate cheats and mitigate against them, while remaining stealthy and invisible itself, is extremely valuable.
EDR and Malware Analysis: Although there is a movement away from having EDR applications reside in the kernel, this won’t happen for quite some time for Windows. And low-level (UEFI and early Windows boot) attacks are the most sophisticated and dangerous forms of malware. And attacks that interact directly with the hardware (think microcode!) are even more dangerous still. Only JTAG operates as an independent hardware-based debugging technology.
Why use it instead of other debuggers?
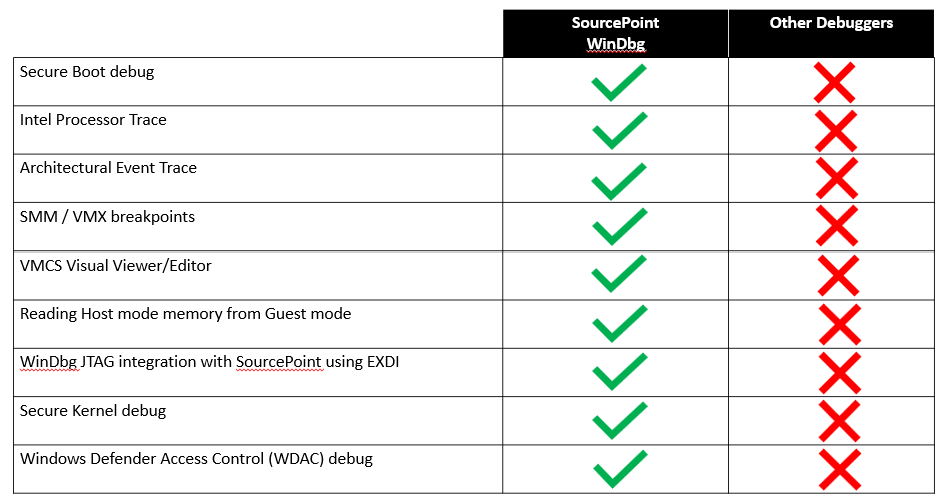
Here’s a table that helps contrast SourcePoint WinDbg against just pure vanilla WinDbg and other debuggers:
What problems does it solve?
Let’s look at this from the perspective of each of the unique features listed above, and what categories it applies to:
Secure Boot debug: Secure Boot is a security feature, enabled by the BIOS, that verifies that only trusted code can execute when a computer starts up. Special code is run with Secure Boot enabled, versus when it is disabled. It is commonly enabled on most modern secured PCs. WinDbg will not debug this code. This feature is thus of interest to those malware researchers who look to determine if rogue code can disable it.
Intel Processor Trace: This unique feature of SourcePoint captures instruction trace, for all code executed, almost at-speed for all user and kernel code. No other tool has this capability. It is useful for all potential use cases: hypervisor/OS development, game anti-cheat, malware research, etc.
Architectural Event Trace (AET): AET is a JTAG-only feature that captures event trace information on a number of low-level features: MSR read/writes, I/O read/writes, Interrupts, Exceptions, etc. You can even set hardware breakpoints, for Code and Data, and capture these breakpoints with instruction trace without stopping the target. This is useful for all potential market segments and use cases.
SMM/VMX breakpoints: SMM is a large attack surface, as evidenced by the Black Lotus attack, among many others. It’s crucial that this high-privileged attack surface be robust and protected – key for UEFI/OS developers and malware researchers. And VMX breakpoints, such as VM Launch, VM Resume and VM Exit, are JTAG-only privileged operations that provide insight into hypervisor operations. With the standardization of hypervisor technology into the foundation of Windows and Linux, OS/hypervisor developers need these kind of capabilities.
VMCS Visual Viewer/Editor: Other debuggers implement scripts that provide a scrolling view of VMCS Root/Non-Root, VM Entry, VM Exit, and VM Execution fields. SourcePoint provides a visual display of all of the above, and provides read/write access. The insight provided by this visualization, enhanced by JTAG, is beyond what is normally possible through any other means. This capability is critical for Windows/Linux/hypervisor developers.
Reading Host mode memory from Guest mode: This would normally be considered impossible. For any agent-based debugger, reading Host memory while the target is in Guest mode (such as NTOS or the Secure Kernel) would be a terrible violation of the underlying physics of hypervisor technology – indicative of a major bug in the root of trust itself. But JTAG, as it comes in from underneath, from the CPU silicon itself, is capable of this. Very important for hypervisor developers.
WinDbg JTAG integration with SourcePoint using EXDI: If you’ve gotten this far in the article, you’re no doubt aware that SourcePoint has been integrated with Microsoft’s WinDbg debugger using the Extended Debug Interface (EXDI). Read this article if you’d like to know more. What this means is that WinDbg can communicate and direct SourcePoint’s JTAG operations: that is, issue a command in the WinDbg syntax, and SourcePoint will initiate the run-control operations via JTAG. This is another example of “1 + 1 = 3”; engineers who are familiar with WinDbg can use it, and also take advantage of all the unique features that SourcePoint has to offer. This capability applies universally to OS/hypervisor developers, game anti-cheat, and EDR and malware researchers.
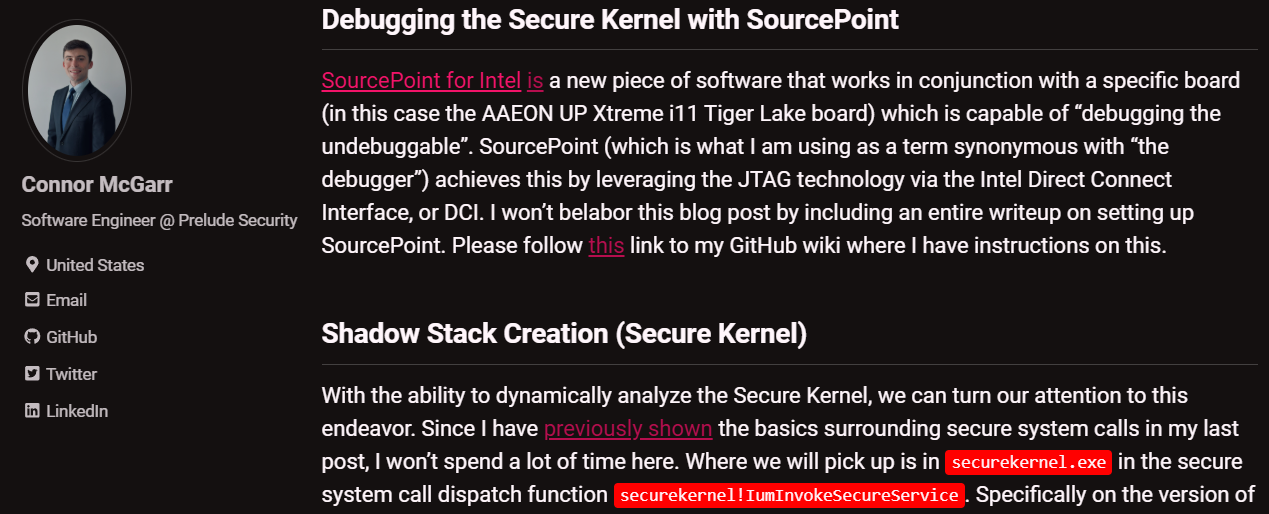
Secure Kernel Debug: Symbols for the Windows Secure Kernel are available on the Microsoft public symbol server, but it is not easy to debug with WinDbg alone. There are various ad hoc means of doing it, but only SourcePoint provides full run-control and trace access to all of the VTL 1 kernel. Combine this access with all of the features listed above, and this provides unparalleled operations into the Secure Kernel. As an example of this, review the article by Connor McGarr, Exploit Development: Investigating Kernel Mode Shadow Stacks on Windows. Connor used SourcePoint to explore the interactions between the secure kernel and the normal kernel in this article:
“This blog post will be divided into two main parts:
- “The NT (ntoskrnl.exe) perspective” (e.g., examining how NT kicks-off the creation of a kernel-mode shadow stack)
- “The Secure Kernel perspective” (e.g., we then will showcase how (and why) NT relies on the Secure Kernel to properly facilitate kernel-mode shadow stacks by actively debugging the Secure Kernel with SourcePoint!).”
Debugging of the Secure Kernel is of course critical to OS developers. The technology associated with this – Hyper-V, VTL 0 and VTL 1 worlds, Virtualization-Based Security (VBS), SystemGuard, and many others – is most easily understood by OS and hypervisor engineers using SourcePoint.
Windows Defender Access Control (WDAC) debug: WDAC is a security feature in Windows that controls which applications can run on a device. It plays a critical role in defending against such attacks like the BlackLotus UEFI Bootkit; to learn more about this feature, see my blog at Debugging Windows Defender Application Control (WDAC) Policies. In his related article, Downgrade attack: a story as old as Windows…, Andrea Allievi of Microsoft called out:
First, useless to say again that initial legacy WDAC policy are processed very early in the boot process, before every kind of debugger connect. So how to debug that? Easy, using JTAG (Exdi) or QEMU. Speaking of them, SourcePoint does a good job in stepping through the initial BootMgr code.
Note that a lot of Code integrity code works only when Secure Boot is on. I have been able to install customized Secure boot keys in my QEMU virtual machine, and realized that in the AAEON board keys are already loaded by default, which mean that you can debug it (using the JTAG EXDI interface connected to SourcePoint) with Secure boot ON and witness also other WDAC policies being applied (like Secure Boot policies, which prevents the enablements of classical kernel debuggers).
With that, I’ll wrap this up. If you’d like to learn more about SourcePoint WinDbg, I’d recommend the excellent webinar video recording, Debugging Hyper-V, Secure Kernel, VBS Enclaves, Defender, and other Windows Secrets (note: requires registration).
That’s it for now. In Part 2 of this series, I’ll be writing about the return on investment (ROI) of better debuggers; and why enterprises involved in OS/hypervisor development, EDR design, malware research and game anti-cheat solutions should equip their engineers with best-in-class productivity tools.