
In my prior two articles, I demonstrated the use of JTAG to set breakpoints inside SMM that survive Entry and Exit, and how to use Last Branch Record (LBR) trace to do dynamic analysis. In this blog, I show how to set up a visual view of SMRAM that updates dynamically as SMIs are hit.
As a recap for the prior two blogs, Part 1 covered the use of SourcePoint’s breakpoints that survive SMM Entry and Exit:
Execute in SMM

Data Access in SMM

Data Write in SMM

I/O Access in SMM
such that it is possible to break in SMM, set the desired above breakpoint type, and then not have the breakpoint disappear upon Exit. This is somewhat amazing, as SMM is designed to clear all hardware and software breakpoints upon Entry/Exit. But, the essence of JTAG is that it can override such mitigations. It is possible even to debug “SMI Storms” with JTAG.
And in Part 2, we saw the use of LBR trace to do dynamic analysis of the SMI Handler. This is the only possible way to see how code flows within SMM. I had several compliments on the difference between regular run-control (setting breakpoints and single-stepping through code) versus trace:
Being able to debug SMM with run-control is very powerful. Run-control means you can halt the target, set breakpoints, single-step through code, etc. But run-control stops the target at a moment in time, allows inspection of its state, and enables you to move forward in time to see what happens. But it doesn’t tell you what happened prior to the initial target halt. It’s like arriving at a car accident scene: yes, you see the car in the ditch, but what happened beforehand? For debugging, this is where trace comes in. Trace allows you to see backwards in time, to where the car hit an oil patch, slid and hit another car, and then rolled over into the ditch.

Another powerful SourcePoint/JTAG feature for SMM debugging is visual display of SMRAM. This is accomplished through the use of the SourcePoint Devices windows, which is thoroughly covered in the SourcePoint User Guide. Here’s an excerpt:
The Devices window allows you to define a custom view of memory. A common use of this view is to display the memory mapped I/O of the devices within a system, or a formatted block of memory. The format of this view is defined by one or more text files called device view files. The extension for these files is ”dev”. Each file contains definitions for one or more devices. Each device contains a number of cell definitions.
Device view files are simple text files that can be created with a text editor. The format is pretty archaic; in a future release, we’ll move to XML, but in the meantime, let’s see how powerful this is.
To display SMRAM, let’s refer back to the Intel SDM for the layout:
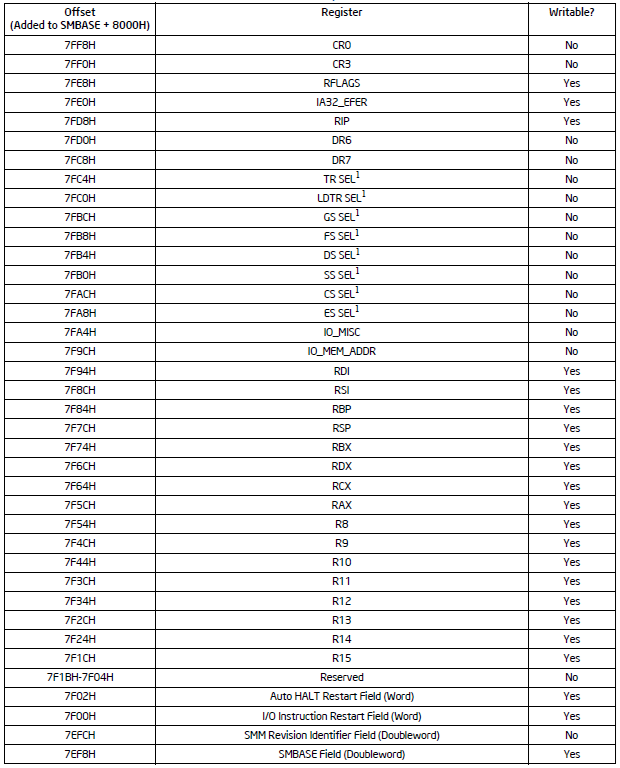
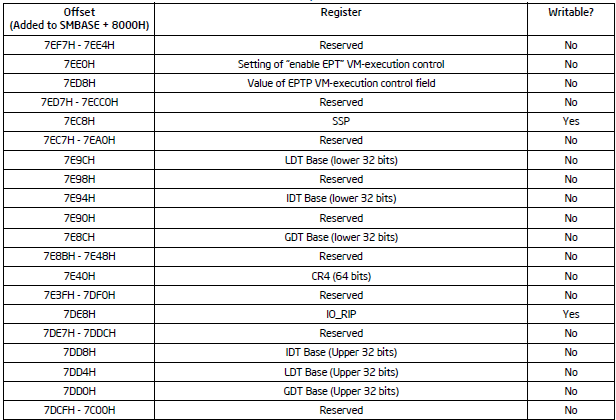
Now, it’s easy enough to replicate this in a Device view (.dev) file. On the AAEON UP Xtreme i11 (Tiger Lake) Celeron board, the complete .dev file looks like this:
[Group]

Name=SMRAM Display

[Device0]

Name= SMRAM State Save Map

// Column Headers

cell0=0,0,text,"Register",text=black

cell1=0,1,text,"Value",text=black


// Values

cell2=1,0,text,"CR0"

cell3=1,1,mem,6ff5aff8L,8

cell4=2,0,text,"CR3"

cell5=2,1,mem,6ff5aff0L,8

cell6=3,0,text,"RFLAGS"

cell7=3,1,mem,6ff5afe8L,8

cell8=4,0,text,"IA32_EFER"

cell9=4,1,mem,6ff5afe0L,8

cell10=5,0,text,"RIP"

cell11=5,1,mem,6ff5afd8L,8

cell12=6,0,text,"DR6"

cell13=6,1,mem,6ff5afd0L,8

cell14=7,0,text,"DR7"

cell15=7,1,mem,6ff5afc8L,8

cell16=8,0,text,"TR SEL"

cell17=8,1,mem,6ff5afc4,4

cell18=9,0,text,"LDTR SEL"

cell19=9,1,mem,6ff5afc0L,4

cell20=10,0,text,"GS SEL"

cell21=10,1,mem,6ff5afbcL,4

cell22=11,0,text,"FS SEL"

cell23=11,1,mem,6ff5afb8L,4

cell24=12,0,text,"DS SEL"

cell25=12,1,mem,6ff5afb4L,4

cell26=13,0,text,"SS SEL"

cell27=13,1,mem,6ff5afb0L,4

cell28=14,0,text,"CS SEL"

cell29=14,1,mem,6ff5afacL,4

cell30=15,0,text,"ES SEL"

cell31=15,1,mem,6ff5afa8L,4

cell32=16,0,text,"IO_MISC"

cell33=16,1,mem,6ff5afa4L,4

cell34=17,0,text,"IO_MEM_ADDR"

cell35=17,1,mem,6ff5af9cL,8

cell36=18,0,text,"RDI"

cell37=18,1,mem,6ff5af94L,8

cell38=19,0,text,"RSI"

cell39=19,1,mem,6ff5af8cL,8

cell40=20,0,text,"RBP"

cell41=20,1,mem,6ff5af84L,8

cell42=21,0,text,"RSP"

cell43=21,1,mem,6ff5af7cL,8

cell44=22,0,text,"RBX"

cell45=22,1,mem,6ff5af74L,8

cell46=23,0,text,"RDX"

cell47=23,1,mem,6ff5af6cL,8

cell48=24,0,text,"RCX"

cell49=24,1,mem,6ff5af64L,8

cell50=25,0,text,"RAX"

cell51=25,1,mem,6ff5af5cL,8

cell52=26,0,text,"R8"

cell53=26,1,mem,6ff5af54L,8

cell54=27,0,text,"R9"

cell55=27,1,mem,6ff5af4cL,8

cell56=28,0,text,"R10"

cell57=28,1,mem,6ff5af44L,8

cell58=29,0,text,"R11"

cell59=29,1,mem,6ff5af3cL,8

cell60=30,0,text,"R12"

cell61=30,1,mem,6ff5af34L,8

cell62=31,0,text,"R13"

cell63=31,1,mem,6ff5af2cL,8

cell64=32,0,text,"R14"

cell65=32,1,mem,6ff5af24L,8

cell66=33,0,text,"R15"

cell67=33,1,mem,6ff5af1cL,8

cell68=34,0,text,"Auto HALT Restart Field"

cell69=34,1,mem,6ff5af02L,2

cell70=35,0,text,"I/O Instruction Restart"

cell71=35,1,mem,6ff5af00L,2

cell72=36,0,text,"SMM Revision Identifier"

cell73=36,1,mem,6ff5aefcL,4

cell74=37,0,text,"SMBASE"

cell75=37,1,mem,6ff5aef8L,4

cell76=38,0,text,"Setting of 'enable EPT' VM-execution control"

cell77=38,1,mem,6ff5ae00L,8

cell78=39,0,text,"Value of EPTP VM-execution control field"

cell79=39,1,mem,6ff5aed8L,8

cell80=40,0,text,"SSP"

cell81=40,1,mem,6ff5aec8L,8

cell82=41,0,text,"LDT Base (lower 32 bits)"

cell83=41,1,mem,6ff5ae9cL,4

cell84=42,0,text,"IDT Base (lower 32 bits)"

cell85=42,1,mem,6ff5ae94L,4

cell86=43,0,text,"GDT Base (lower 32 bits)"

cell87=43,1,mem,6ff5ae8cL,4

cell88=44,0,text,"CR4"

cell89=44,1,mem,6ff5ae40L,8

cell90=45,0,text,"IO_RIP"

cell91=45,1,mem,6ff5ade8L,8

cell92=46,0,text,"IDT Base (upper 32 bits)"

cell93=46,1,mem,6ff5add8L,4

cell94=47,0,text,"LDT Base (upper 32 bits)"

cell95=47,1,mem,6ff5add4L,4

cell96=48,0,text,"GDT Base (upper 32 bits)"

cell97=48,1,mem,6ff5add0L,4
Easy, right?
And as an example, when we hit the first SMM Entry from the UEFI shell with a SourcePoint breakpoint, the display looks like this:
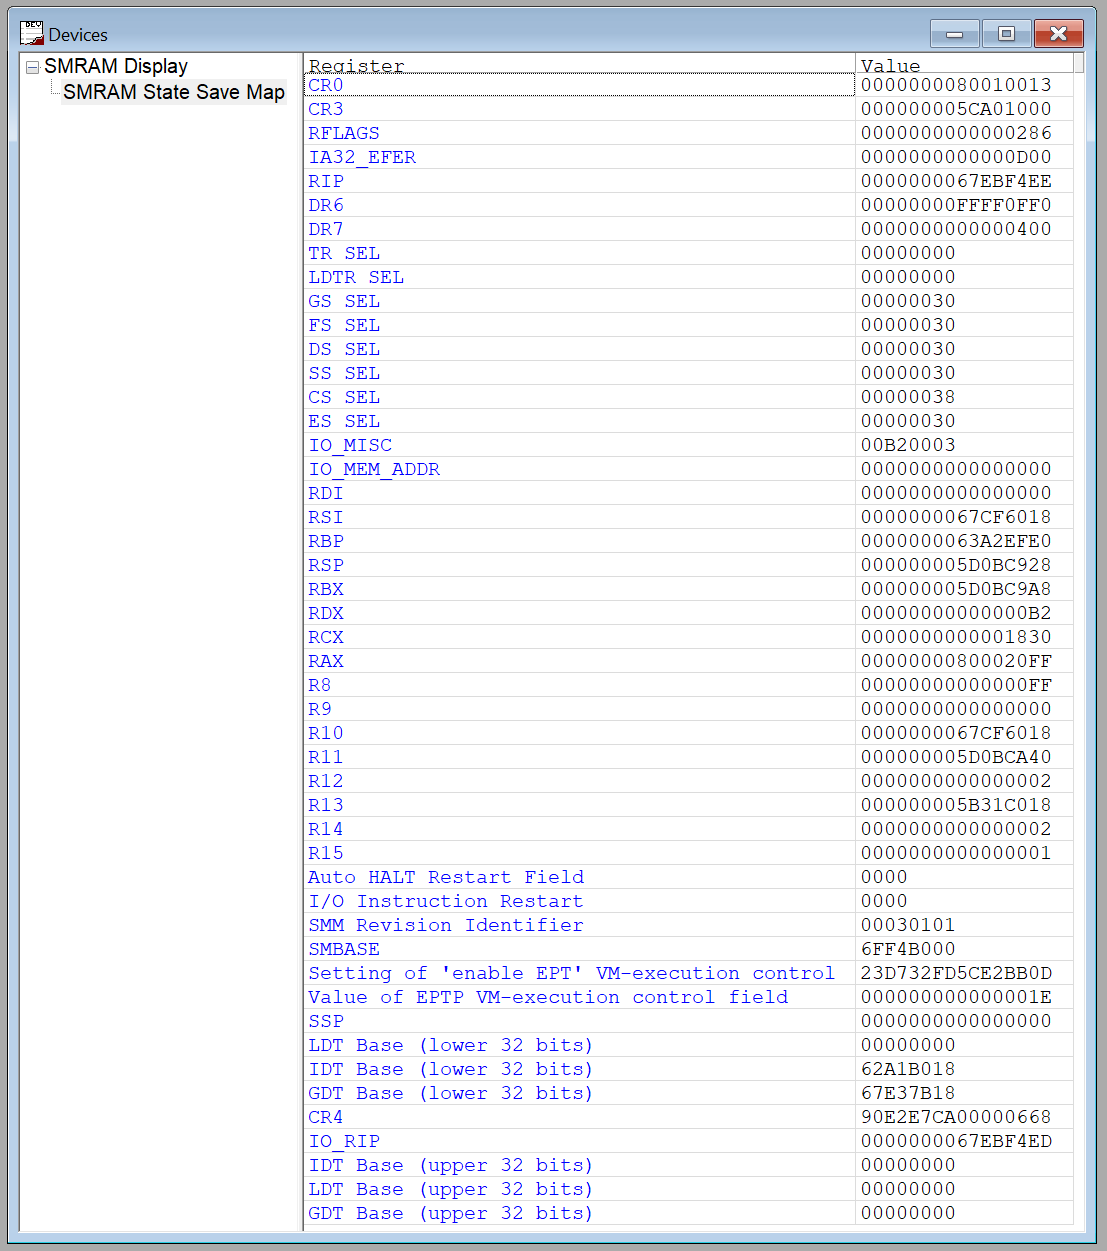
And here’s a short (four-minute) video of the changes within the SMRAM State Save Area as we boot from the UEFI shell up to Windows:
If you look carefully, you can see the State Save Area changing between each one of the SMM entries that happen on the way to the Windows desktop.
And there are more after that – that’ll be a topic of a future blog.
If you’re deeply interested in the use of JTAG for reverse engineering, I’d recommend my webinar from late last year.
And the SourcePoint WinDbg home page is here.