SourcePoint for Intel
Home / Products / SourcePoint / SourcePoint Intel
About SourcePoint for Intel
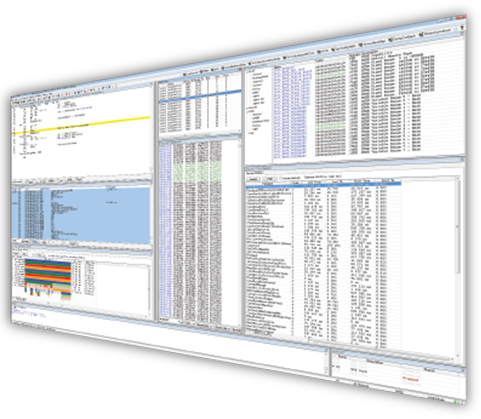
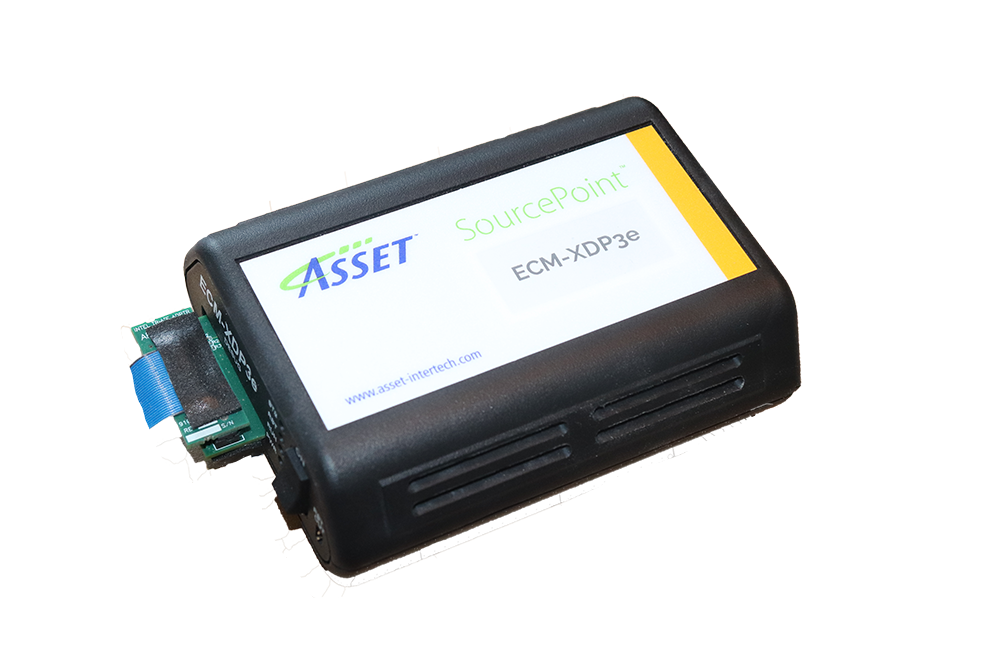
SourcePoint is a powerful debugger for complex multiprocessor software for the latest Intel processors. Its support for Intel silicon soon after it’s available, and Intel CScripts support, ensure timely board bring-up and platform validation.
SourcePoint is the premier UEFI debugger for code development. Navigating the ever-growing UEFI code base is critical to minimizing bug identification cycles and shortening development time.
By working with the latest silicon trace features, like Intel Processor Trace and Trace Hub, SourcePoint finds bugs fast, slashing debug time.
SourcePoint operates in multiprocessor environments and runs on MS Windows. Features are added constantly to keep up with the ever-changing nature of software development challenges.

UEFI debug
Powerful run-control and macro features to make SEC, PEI, DXE and BDS debug a breeze
Trace
Intel Architectural Event Trace, CSME Trace, UEFI Message Trace, Processor Trace, and more
CScripts
Hundreds of platform validation, test and debug scripts courtesy of Intel
Latest Intel silicon
Sapphire Rapids, Alder Lake, Rocket Lake, and every other codename you can imagine
- Source code debug
- Multicore/socket support
- Trace data mining
- Trace statistics
- Code profiling
- Call charts
- High-speed downloads
- Advanced breakpoints
- Auto-target acquisition
- Fast symbol search
- Command language
- Macro support
SourcePoint for Intel Software
Users in organizations such as Dell, HP Enterprise, HP, Cisco, EMC, Fujitsu, Intel, Lenovo, Lockheed, NEC and many others agree that SourcePoint’s usability and visibility lead the industry, especially when it comes to UEFI debug. From examining code execution at a system-level to bit-level, as well as scrutinizing the most hardware intensive code
SourcePoint has the ability to traverse code hierarchy. Users are provided insight into performance bottlenecks so code can be tuned as necessary. And finding bit-level problems within the most challenging bugs has never been so easy.
Related Products
Wow! Powerful new features in Intel silicon just for the software developers! Are you taking advantage of these features? Or more accurately are your tools enabling you to minimize your debug time by exposing the features?
Intel’s new Trace Hub and Intel Processor Trace are but two of the newer features from Intel and SourcePoint is first to market with support.


Intel JTAG debugger products are designed to make the developer’s job easier. We have worked with Intel for over fifteen years, providing tools that are feature-rich in both hardware and software, making it easy for the user to accelerate development time. An example is UEFI development, where we provide macro files that allow for context-sensitive debugging in the PEIM, DXE and other boot phases.
Intel Processors Supported
- Intel Atom
- Intel Core
- Intel Xeon
Platform Support
- Purley
- Whitley
- Eagle Stream
- Skylake Clients
- Coffee Lake
- Rocket Lake
- Tiger Lake
- Alder Lake
- Apollo Lake
- Gemini Lake
- Jasper/Elkhart Lake
- and more…
Compiler Support
- GNU C/C++
- Intel® C/C++ Compiler
- Microsoft® Visual Studio®
- Borland C++ Compiler
- Wind River® Workbench
- Wind River® Tornado® II C/C++
- CAD-UL C
Intel Programs

SourcePoint for Intel Resources
SourcePoint for Intel eResources
SourcePoint has native support for all UEFI-based platforms. Set breakpoints, single step,watch variables, view the stack, and use powerful tracing features in SEC, PEI, DXE and BDS boot phases of UEFI.
Blog Posts About SourcePoint for Intel
The Mysterious Behavior of the Intel E-cores
Debugging, Reverse Engineering, and Malware Research – The Value of Better Tools: Part 2
Debugging SMM with JTAG: Part 3
Debugging SMM with JTAG: Part 2
SourcePoint for Intel Videos
Learn More Live
Here’s your chance to see how easy it is to validate and test using SourcePoint or ScanWorks. Let us walk you through it!


